Your Grist table, as a project plan
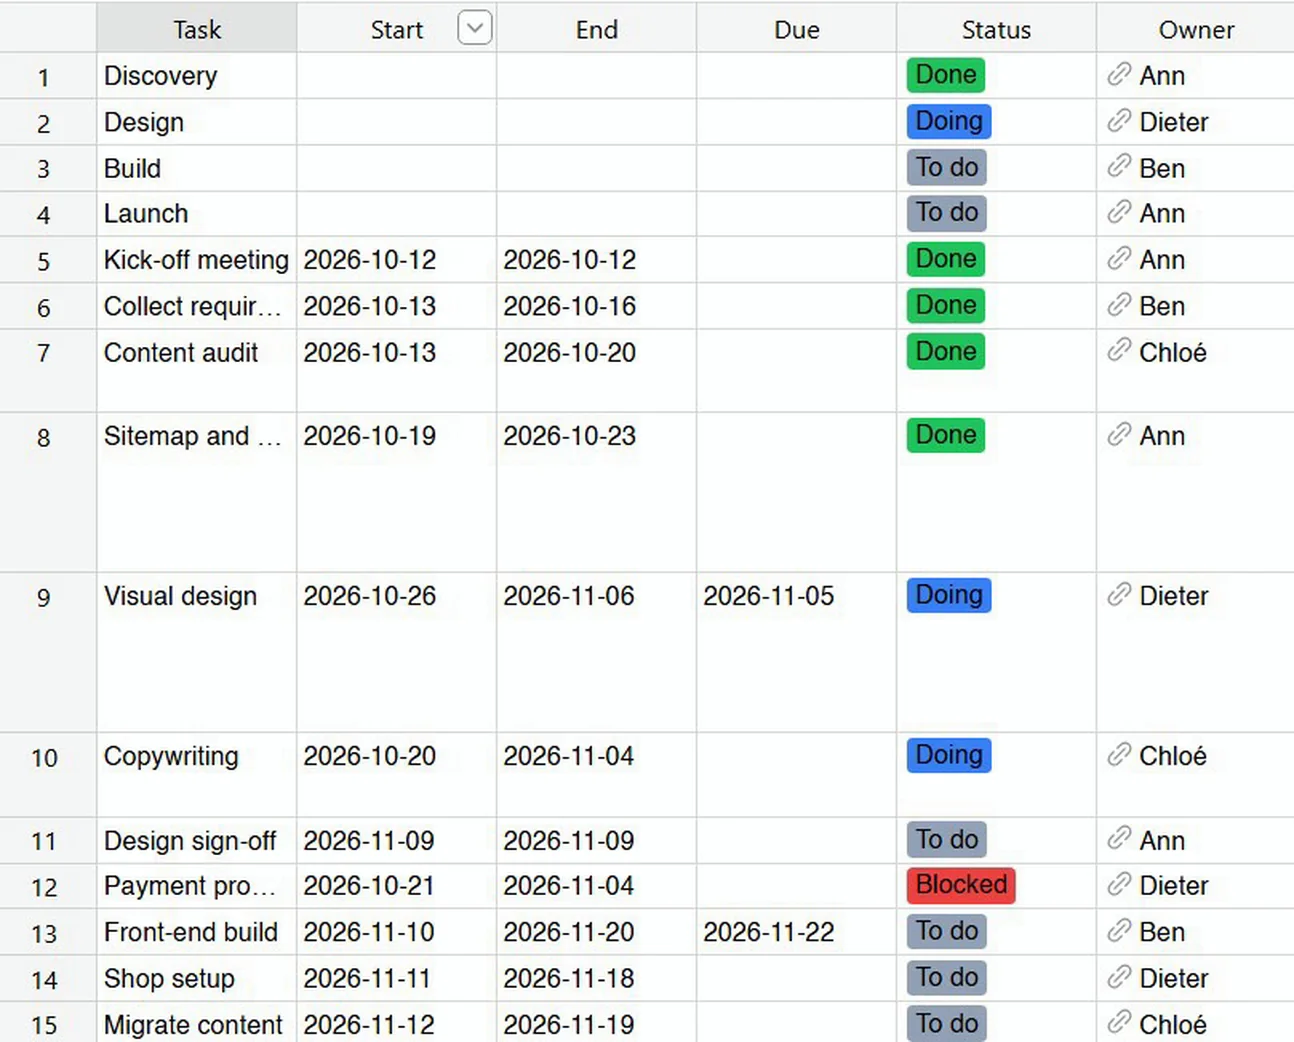
A Grist table with dates, a status and a person is already a plan. Plan Studio draws it as a Gantt chart, and as a timeline, a board, a calendar, a booking grid, a workload, an agenda and an overview. Every change goes back into the same rows. It runs in your browser and reads the columns you already have.
This guide is about a Grist Gantt chart made from your own table: Plan Studio, the free widget we built for it. It shows what Grist already gives a plan, how to add the widget in two minutes, every view with a screenshot, how a task shows its photos and files when you point at it, and what the widget cannot do.
A plan in Grist without a widget
Grist is a good home for a plan, because a plan is a table. Each row is a task with a start, an end, a status and a person. Grist sorts and filters that table, shows the selected row in a linked card, and keeps the document’s history. Its own Project Management template starts you off with tasks that have a due date, a status and an assignee.
For dates on a calendar, Grist has its own Calendar widget. It shows the rows of a table on a calendar: you add an event with a double click, drag it to move it or to change its end, and the change goes into the table, as Grist’s calendar page describes. For a team that plans by the day, that can be enough.
A project plan asks for more than dates. Some tasks wait for others. People have only so many hours in a week. A sponsor wants to see what is late. When we read Grist’s widget gallery on 25 October 2026, it had no Gantt chart, no board, no timeline, no booking grid and no workload view. Plan Studio adds all of them to the table you already keep, and the Grist Gantt chart is where most plans start.
Live, interactive demo
This is the real widget, the same page you paste into Grist, on a made-up website relaunch with 22 tasks and four people. It opens on the Gantt chart. Click anything: drag a bar, point at Visual design to see its files, open the Board or the Workload, or choose Pop-up stores under Example for the booking grid. It runs on sample data in your browser, so nothing you change is kept.
Watch the overview (3 minutes)
The overview shows the Gantt chart and every other view once, on the same made-up plan as the screenshots in this guide. Three tutorials then go through it step by step.
Chapters: jump to any part
The tutorials, step by step
- Step 1: add it to Grist and make your first plan (2:41)
- Step 2: links, the critical path and the plan against what happened (2:10)
- Step 3: groups, filters, several tasks at once and saved views (2:23)
Add Plan Studio to your Grist document
- Add a page with a custom widget. In your document, press Add New, then Add Page. Choose Custom as the widget and your table of tasks under Select data, then Add Page.
- Paste the address into the Custom URL card of Choose custom widget, and press Add widget:The first time, Grist warns about custom widgets from outside its gallery. Tick the box and confirm. The code is public on GitHub, so you can read it before you trust it.
https://anupress.github.io/grist-plan-studio/ - Accept full document access when Grist asks. The creator panel then reads Full document access.
- Check what it found. The Gantt chart appears when your columns have names it knows. Settings says in one sentence how it reads the table, and you can change any column there.
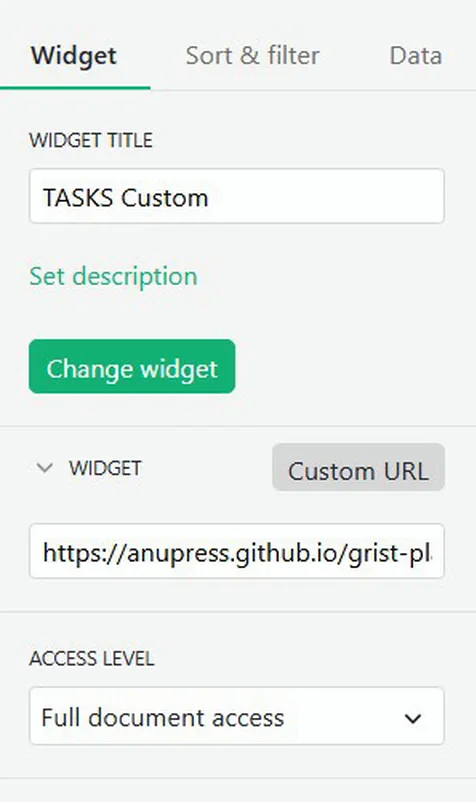
Grist Desktop works the same way; we tested version 0.3.16 on Windows. Self-hosted Grist takes the same address, and
GRIST_WIDGET_LIST_URL set to https://anupress.github.io/grist-plan-studio/manifest.json puts
Plan Studio in its Custom widget picker.
It reads the columns you already have
Plan Studio never asks for a schema of its own. It works out which column holds the name, the start, the end, the due date, the person, the status and the rest, so the Gantt chart appears without any setup in most tables.
- Grist’s templates: Project Management, Lab Project Management, Rental Management and Content Calendar are recognised whole and need no setup.
- Any other table is matched by its column names in English, German or French. A part of a task with no column offers Add a column for it, and asks first.
- An empty table offers three starters: a project plan, an event booking plan and a room booking. Each says what it adds before it adds it, and Grist’s Undo takes it back.
- When it cannot tell which columns hold the dates, Set up my plan asks three plain questions: when a task starts, when it ends or is due, and who does it.
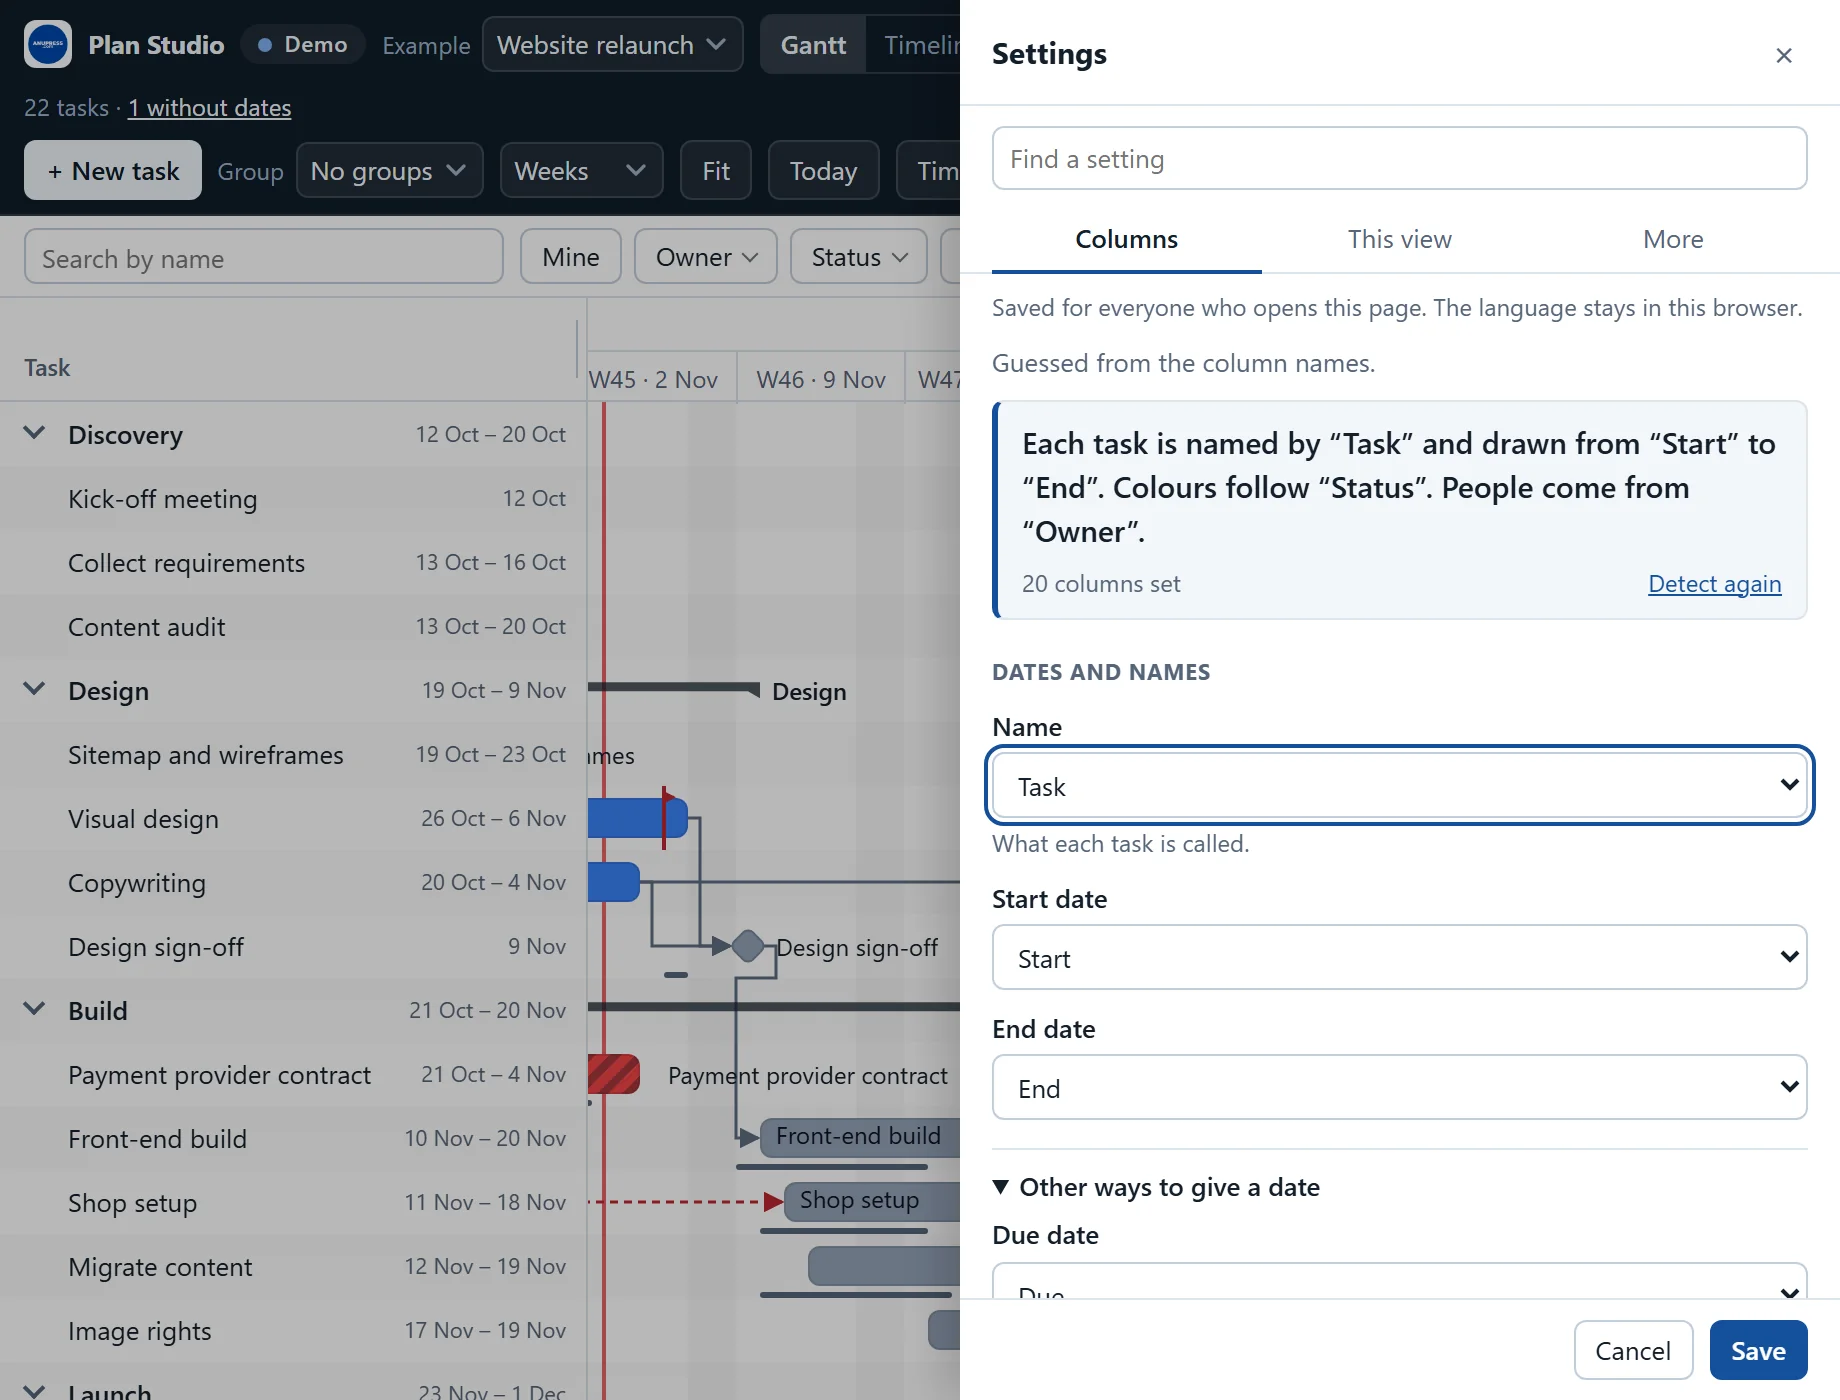
Settings shows the result in one sentence, such as “Each task is named by Task and drawn from Start to End”, with each part of a task and its column below it. The tab This view holds the options of the view on show, like working days and public holidays for the Gantt chart. More holds the rest, and Find a setting searches all three tabs.
The Grist Gantt chart: drag, zoom and fold
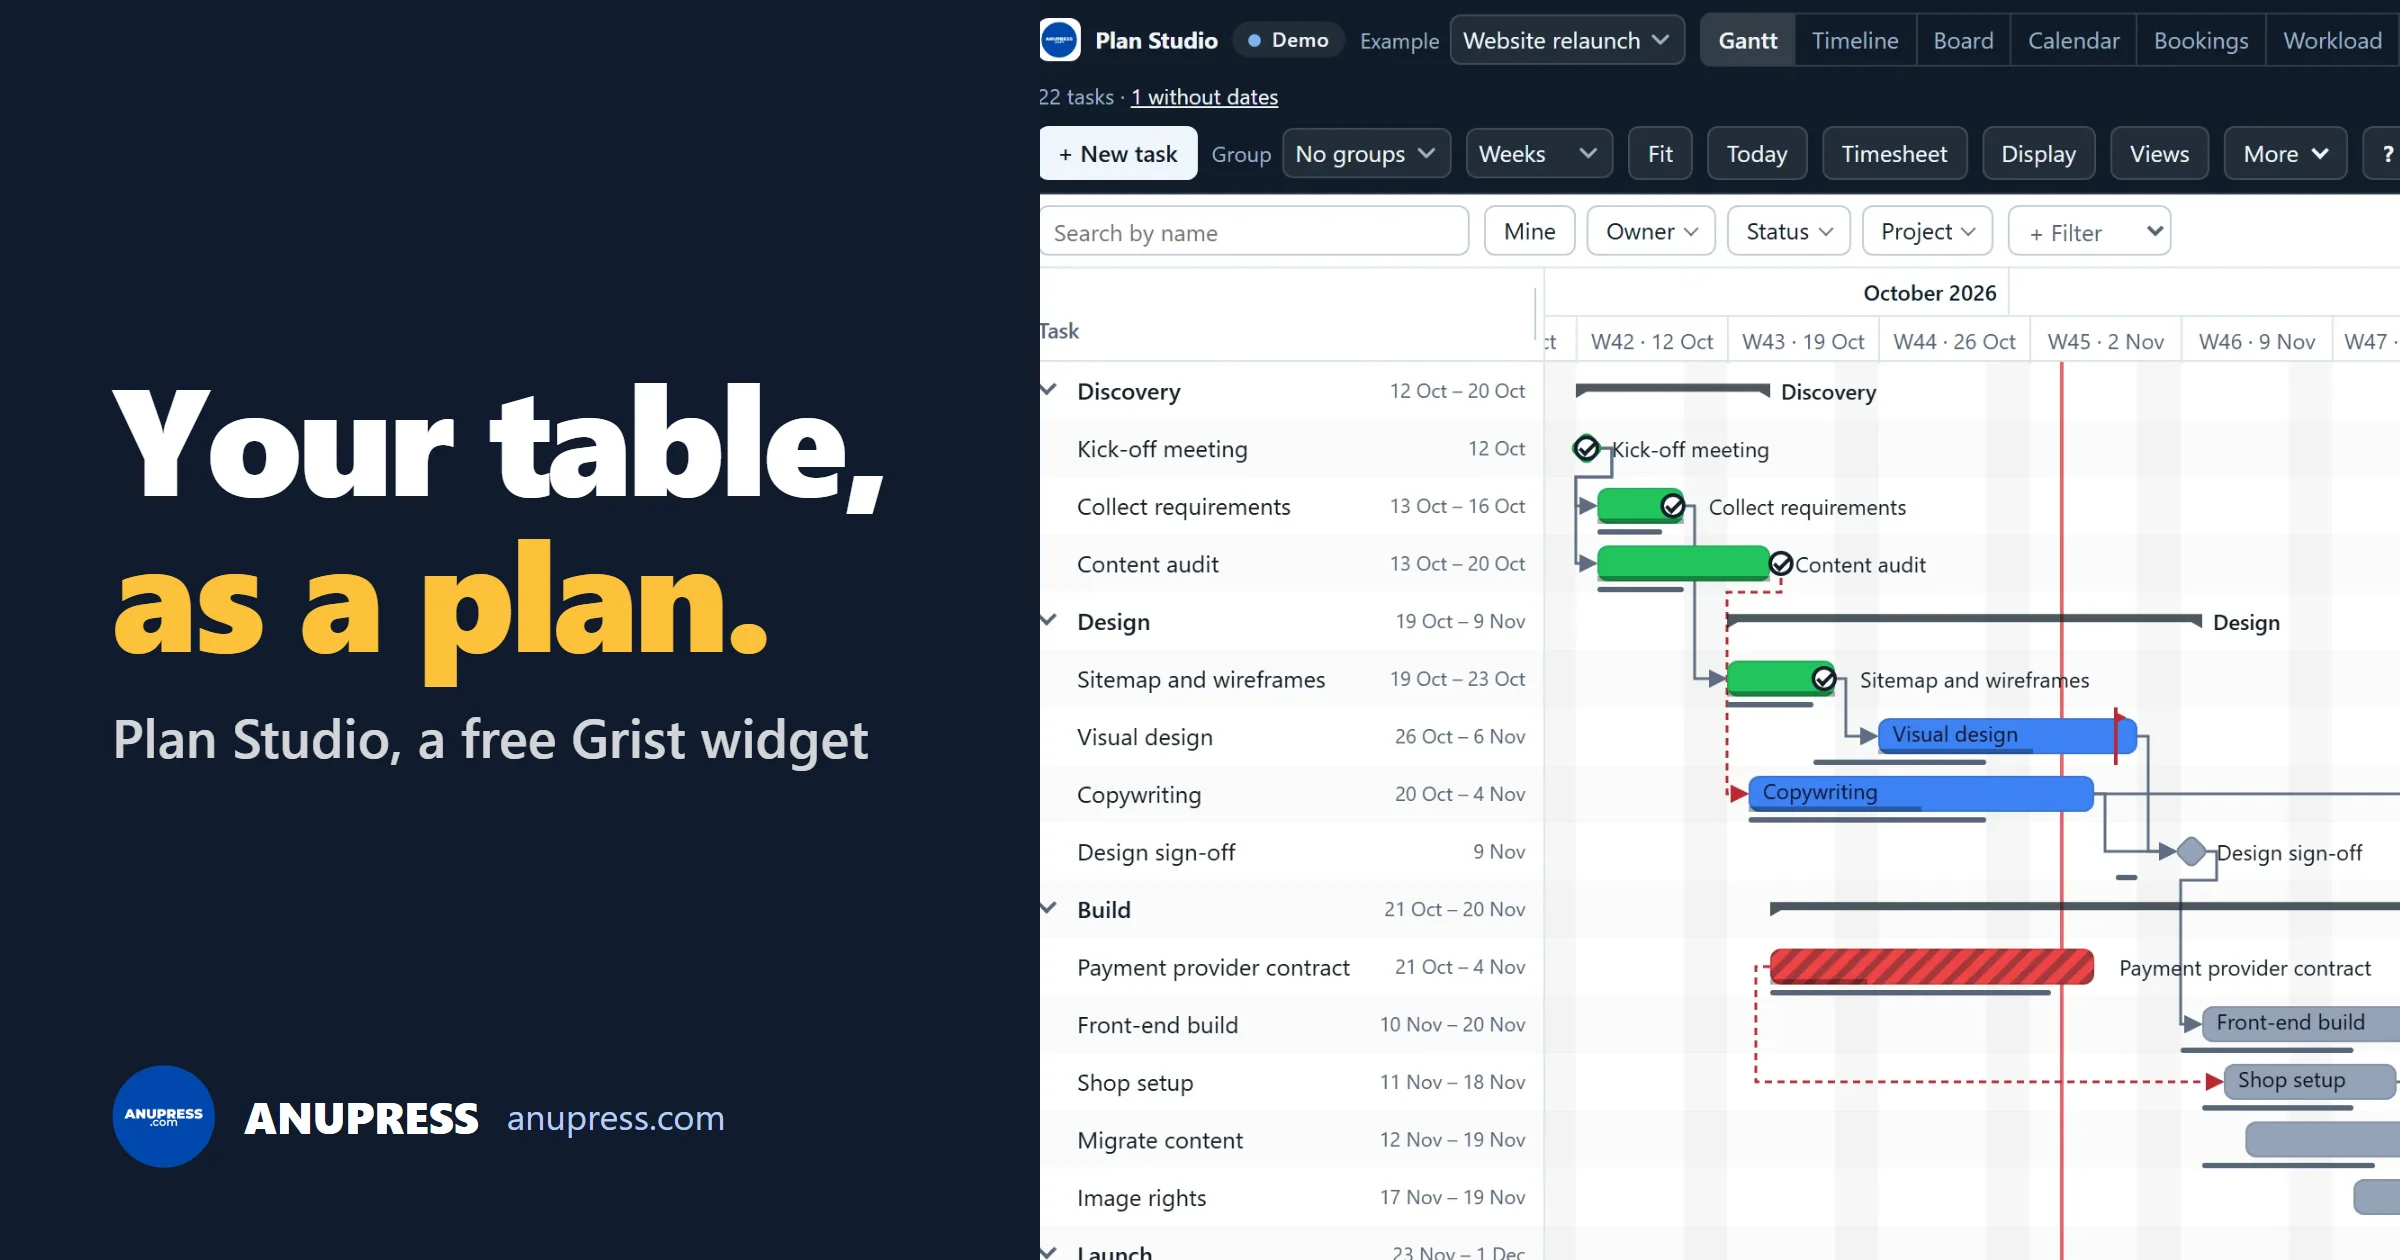
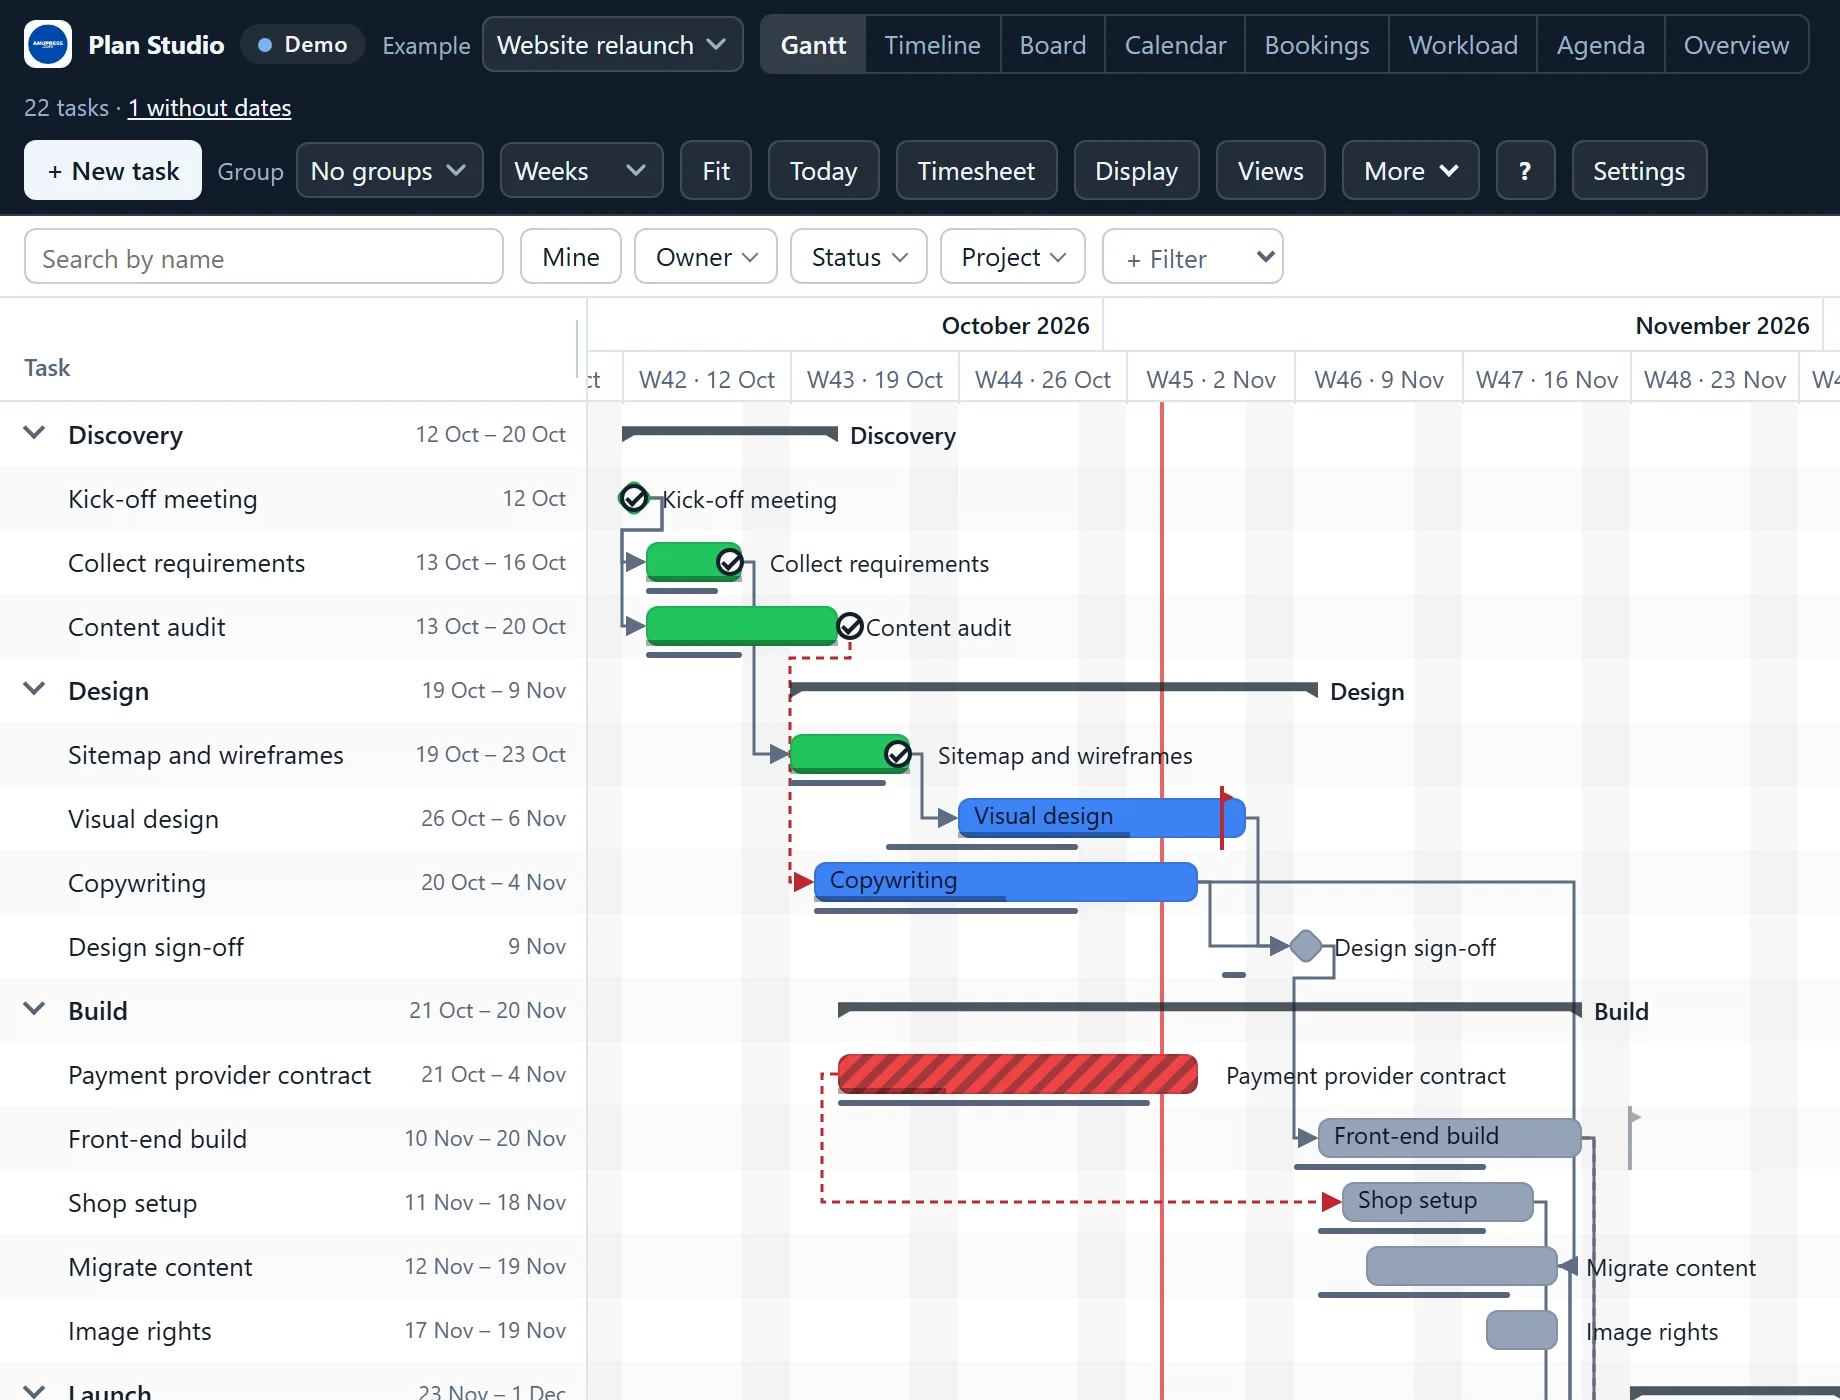
Each task is a bar from its start to its end, a parent task is a line over its sub-tasks, and a milestone is a diamond. Everything you do in the Gantt chart writes to the table:
- Drag a bar to move a task, or its right end to change when it ends. The tooltip shows the new dates while you drag.
- Drag across the row of a task with no dates to give it some.
- Zoom from Days to Years, drag an empty part of the chart to move along, and press Today to come back.
- Fold a group with the arrow next to it, so its tasks become one line.
- Edit a task: click it and press Enter. Its window has the status, the progress, the dates, the person and the rest. New task opens the same window for a task dated today.
Every change is one Grist action, so one Ctrl+Z, in Grist or in the widget, takes it back. Formula columns are never written: a date that comes from a formula shows in the Gantt chart, but it does not move.
Gantt chart links, the critical path and the plan against what happened
A link says that one task waits for another. In the Gantt chart, drag the dot at the end of a bar onto the task that waits, and an arrow appears. Plan Studio writes the link to the task’s Depends on column.
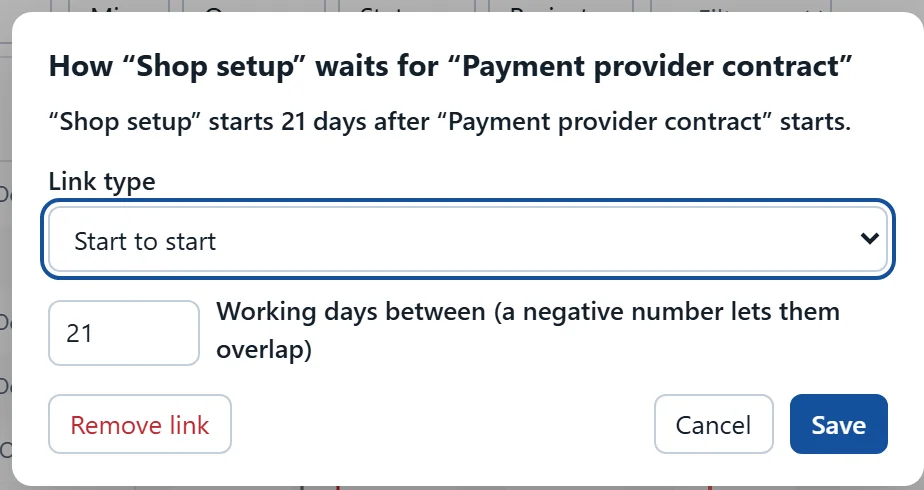
Click an arrow to say how the two are tied: finish to start (the default), start to start, finish to finish or start to finish, and how many days lie between them. A negative number lets them overlap. The sentence in the window follows your choice, and a link that the dates break turns red. The kind of link and the days go into two columns of the task that waits, which the window adds after asking.
When you move a task that others wait for
Drag a task later, and the tasks that wait for it would start too early. So Plan Studio asks first, then moves them by the same number of days, and one Ctrl+Z takes all of it back. Close the gaps (in More, in the Gantt chart) works the other way round: it lists every task that could start earlier, from and to, and moves them in one step. Nothing moves before today, and a task that has started stays where it is.
The critical path
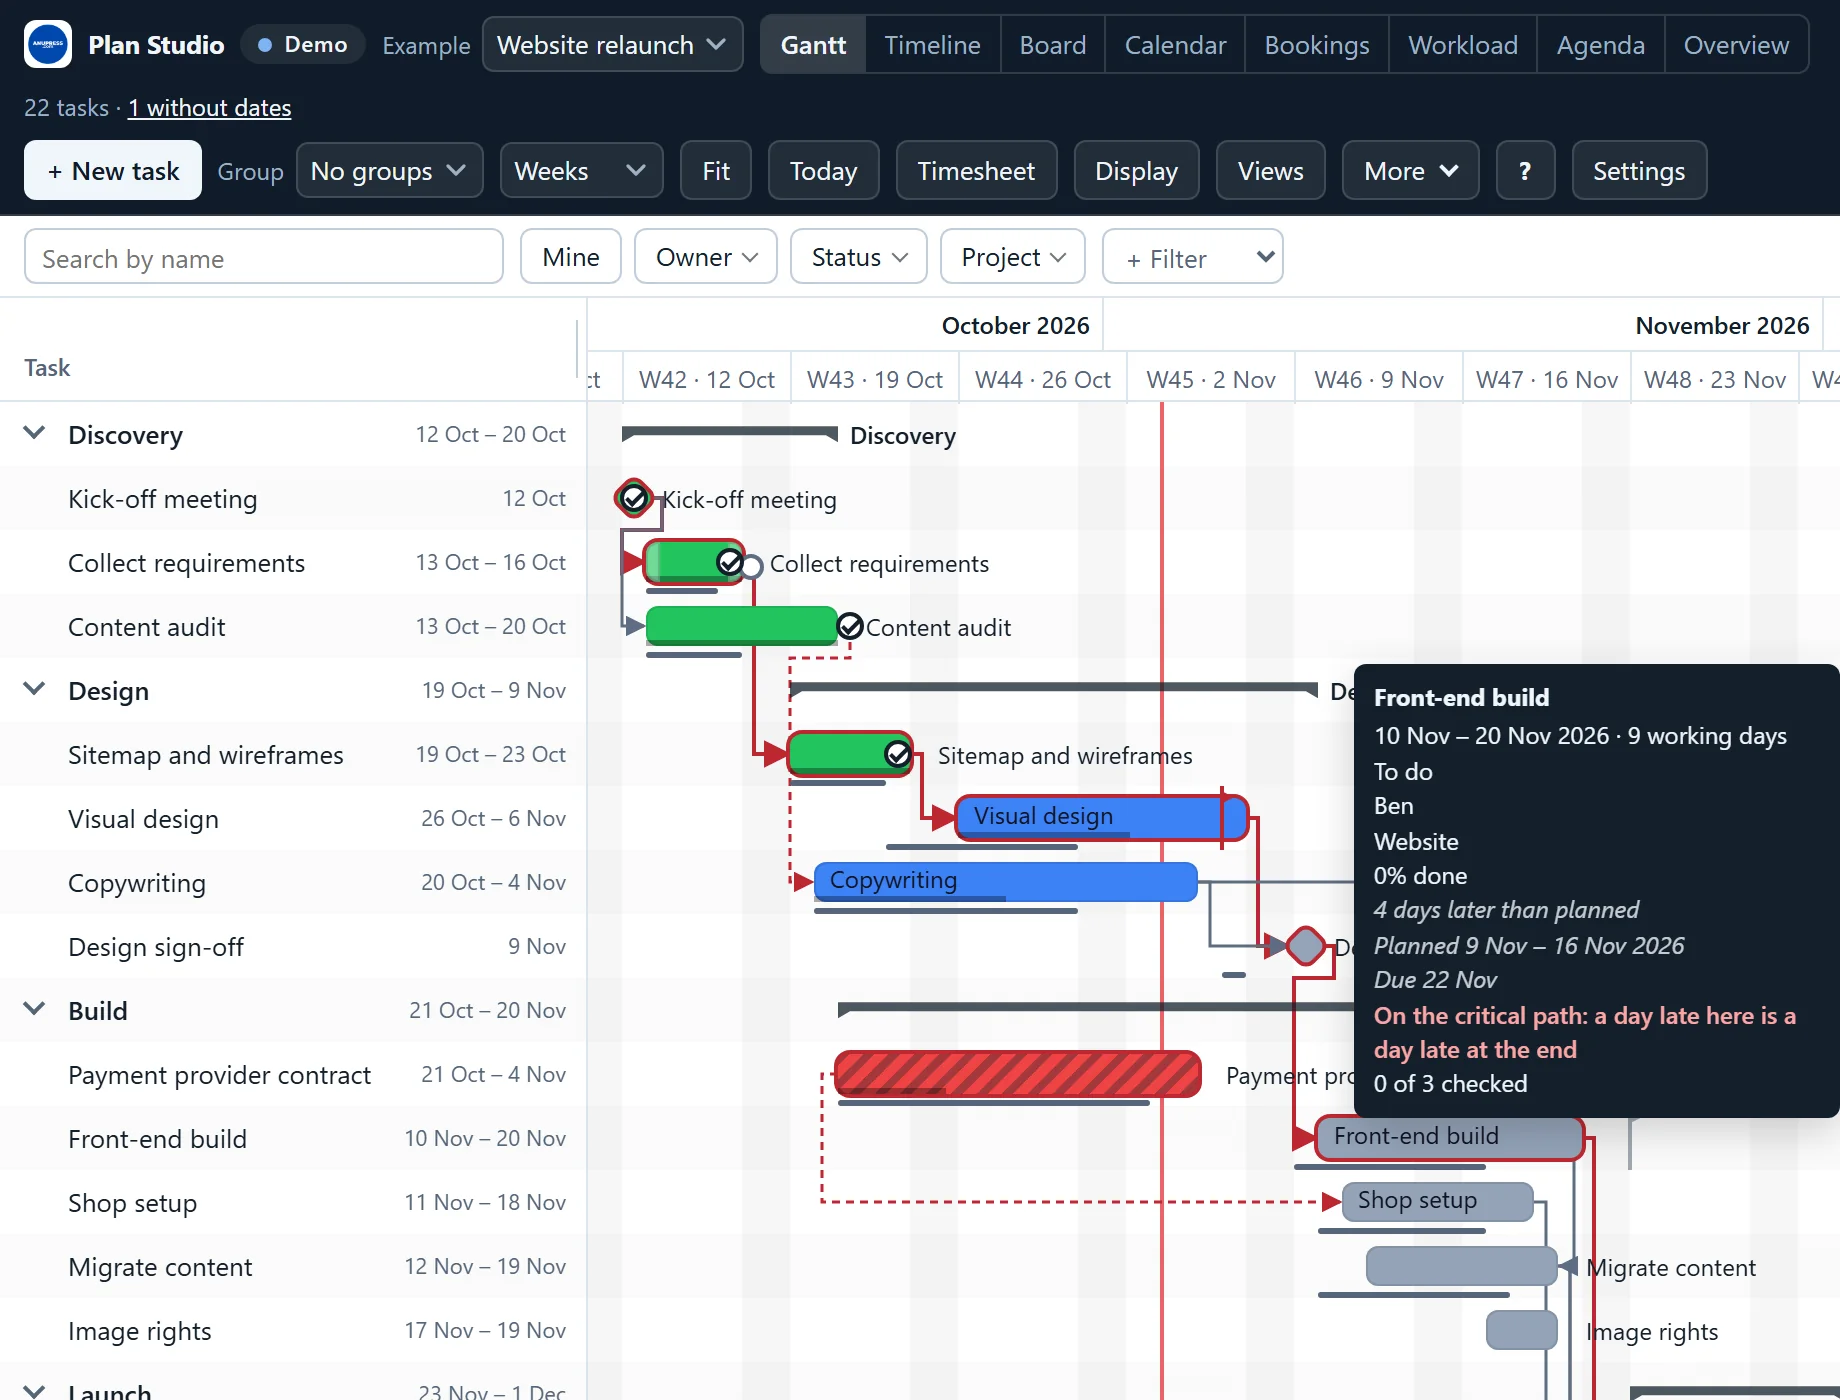
In the Gantt chart, More → Critical path outlines in red the chain of tasks that sets the end date. A day late on any of them is a day late at the end, and the tooltip of each says so. The push, Close the gaps, Level and the critical path all follow the kind of link and the days between.
The plan against what happened
Set baseline (in the Gantt chart’s More menu) keeps today’s dates of every task as its plan, in two Date columns, Planned start and Planned end. Later, a thin line under a bar shows the plan, and the words say how far the task moved: “4 days later than planned”. A Done on column puts a ✓ on the day a task was finished. A task whose due date comes before its end gets a small flag, red when it ends too late, and a blocked task is striped. In the Gantt chart screenshots above, the grey lines under the bars are the plan.
See a task’s photos and files when you point at it
Many plans keep files next to the tasks: a sketch, a draft, a photo from the site. If your table has an Attachments column, Plan Studio shows them where you are already looking.
- Point at a bar in the Gantt chart, at a bar in the timeline or at a booking in the booking grid. Under the dates, the tooltip shows the first three files of the task. A photo or a drawing (PNG, JPEG, GIF, WebP, SVG, AVIF or BMP) shows as a small picture, any other file as its type, such as PDF or DOCX, each with its name. “and 2 more” says when there are more.
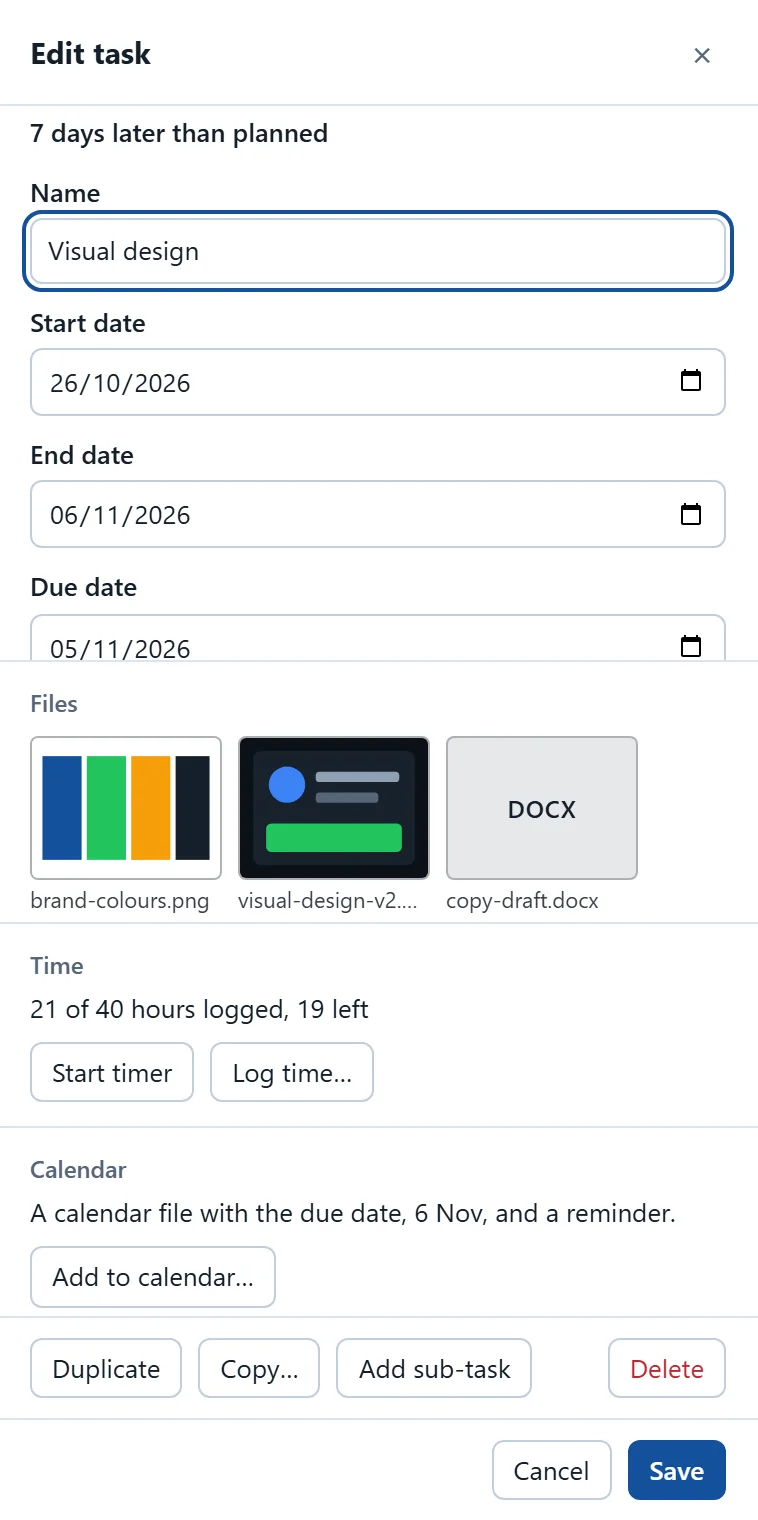
- The edit window lists up to twelve, larger. A click opens a file in a new tab.
- It finds the column by its name (Files, Attachments, Anhänge or Pièces jointes), or as the table’s only Attachments column.
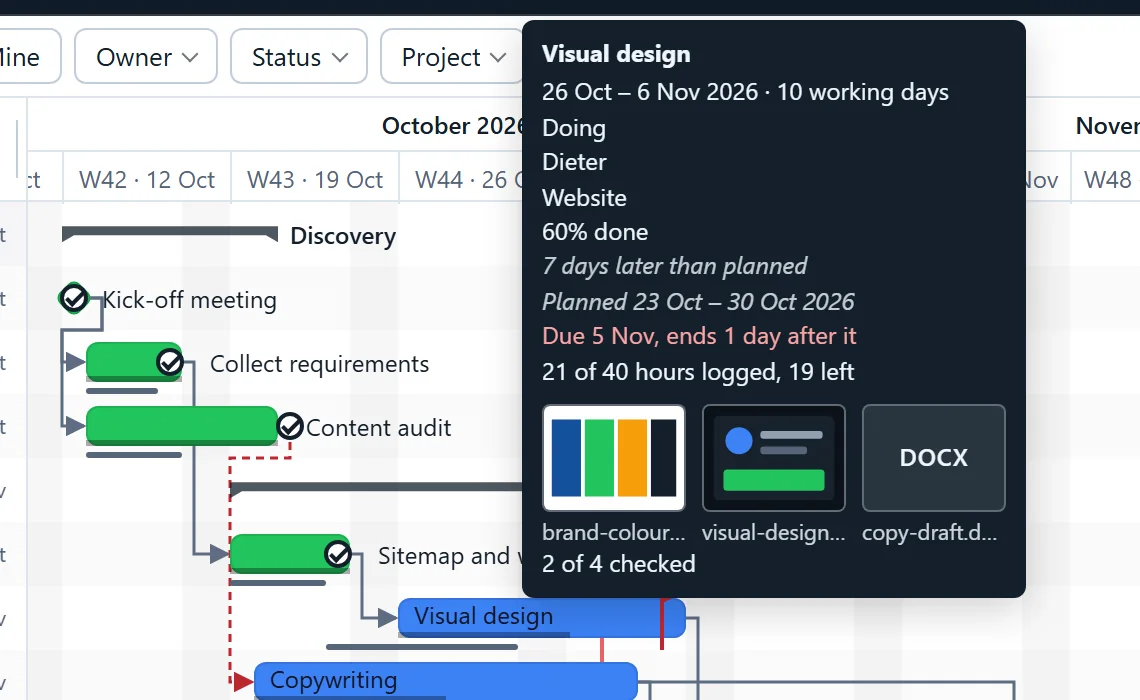
Plan Studio only reads the files; it never adds or removes one. To read them, Grist gives the widget a read-only link that runs out after a few minutes. The widget renews it, keeps it only in memory and shows it to nobody, and nothing is written to the document.
You add files in Grist’s own Attachments cell, or with File Studio, our free widget for Grist attachments, which puts all the files of a table on one screen. Both widgets can sit on the same page.
Seven more views of the same table
The buttons at the top switch between eight views of the same rows. A change in any of them writes to the same table, so the Gantt chart, the board and the calendar never disagree.
| View | Rows are | What you do in it |
|---|---|---|
| Gantt chart | tasks, with parents and links | drag bars and their ends, link tasks, fold parents, show the critical path |
| Timeline | a band per person, room or project | drag a bar to another band to reassign it, or along it to move it |
| Board | cards in a lane per status, person or any column | drag cards between lanes and rows, add cards, set lane limits |
| Calendar | a month or a week | drag a bar to another day, drag its edge, or drag across empty days to add a task |
| Booking grid | resources against periods | see free cells counted per period, book one with a click, spot double bookings |
| Workload | people against days, weeks or months | see who has more work than hours, list the tasks behind a cell, Level the plan |
| Agenda | open tasks under the day they need someone | late first, then today, tomorrow and the weeks ahead; the first view on a phone |
| Overview | the plan in numbers | see what is open, late or done by status or person, and print a one-page report |
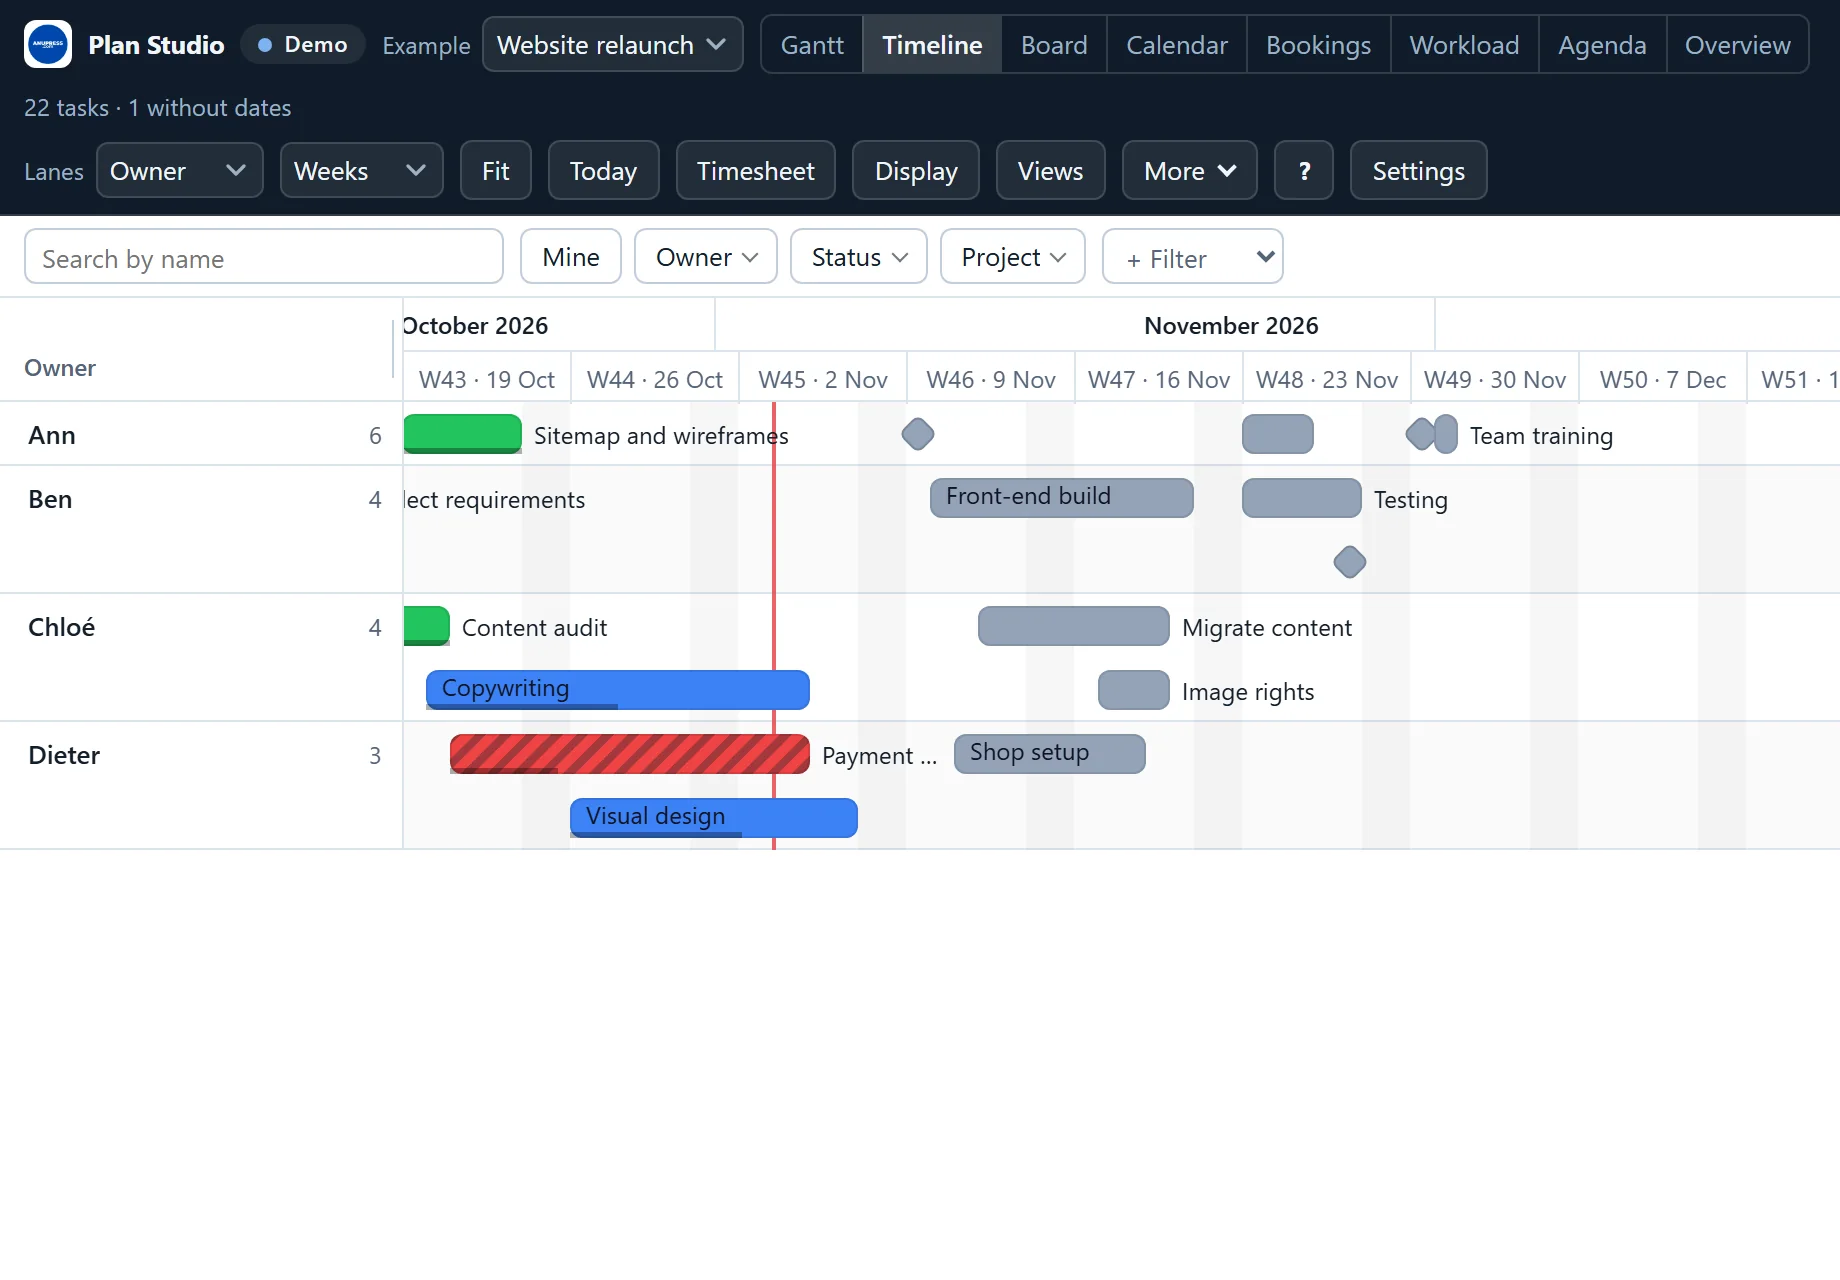
Timeline: a band for each person
The same tasks as in the Gantt chart, with a band for each person, room or project. Drag a bar to another band and the task goes to someone else; drag it along the band and its dates move.
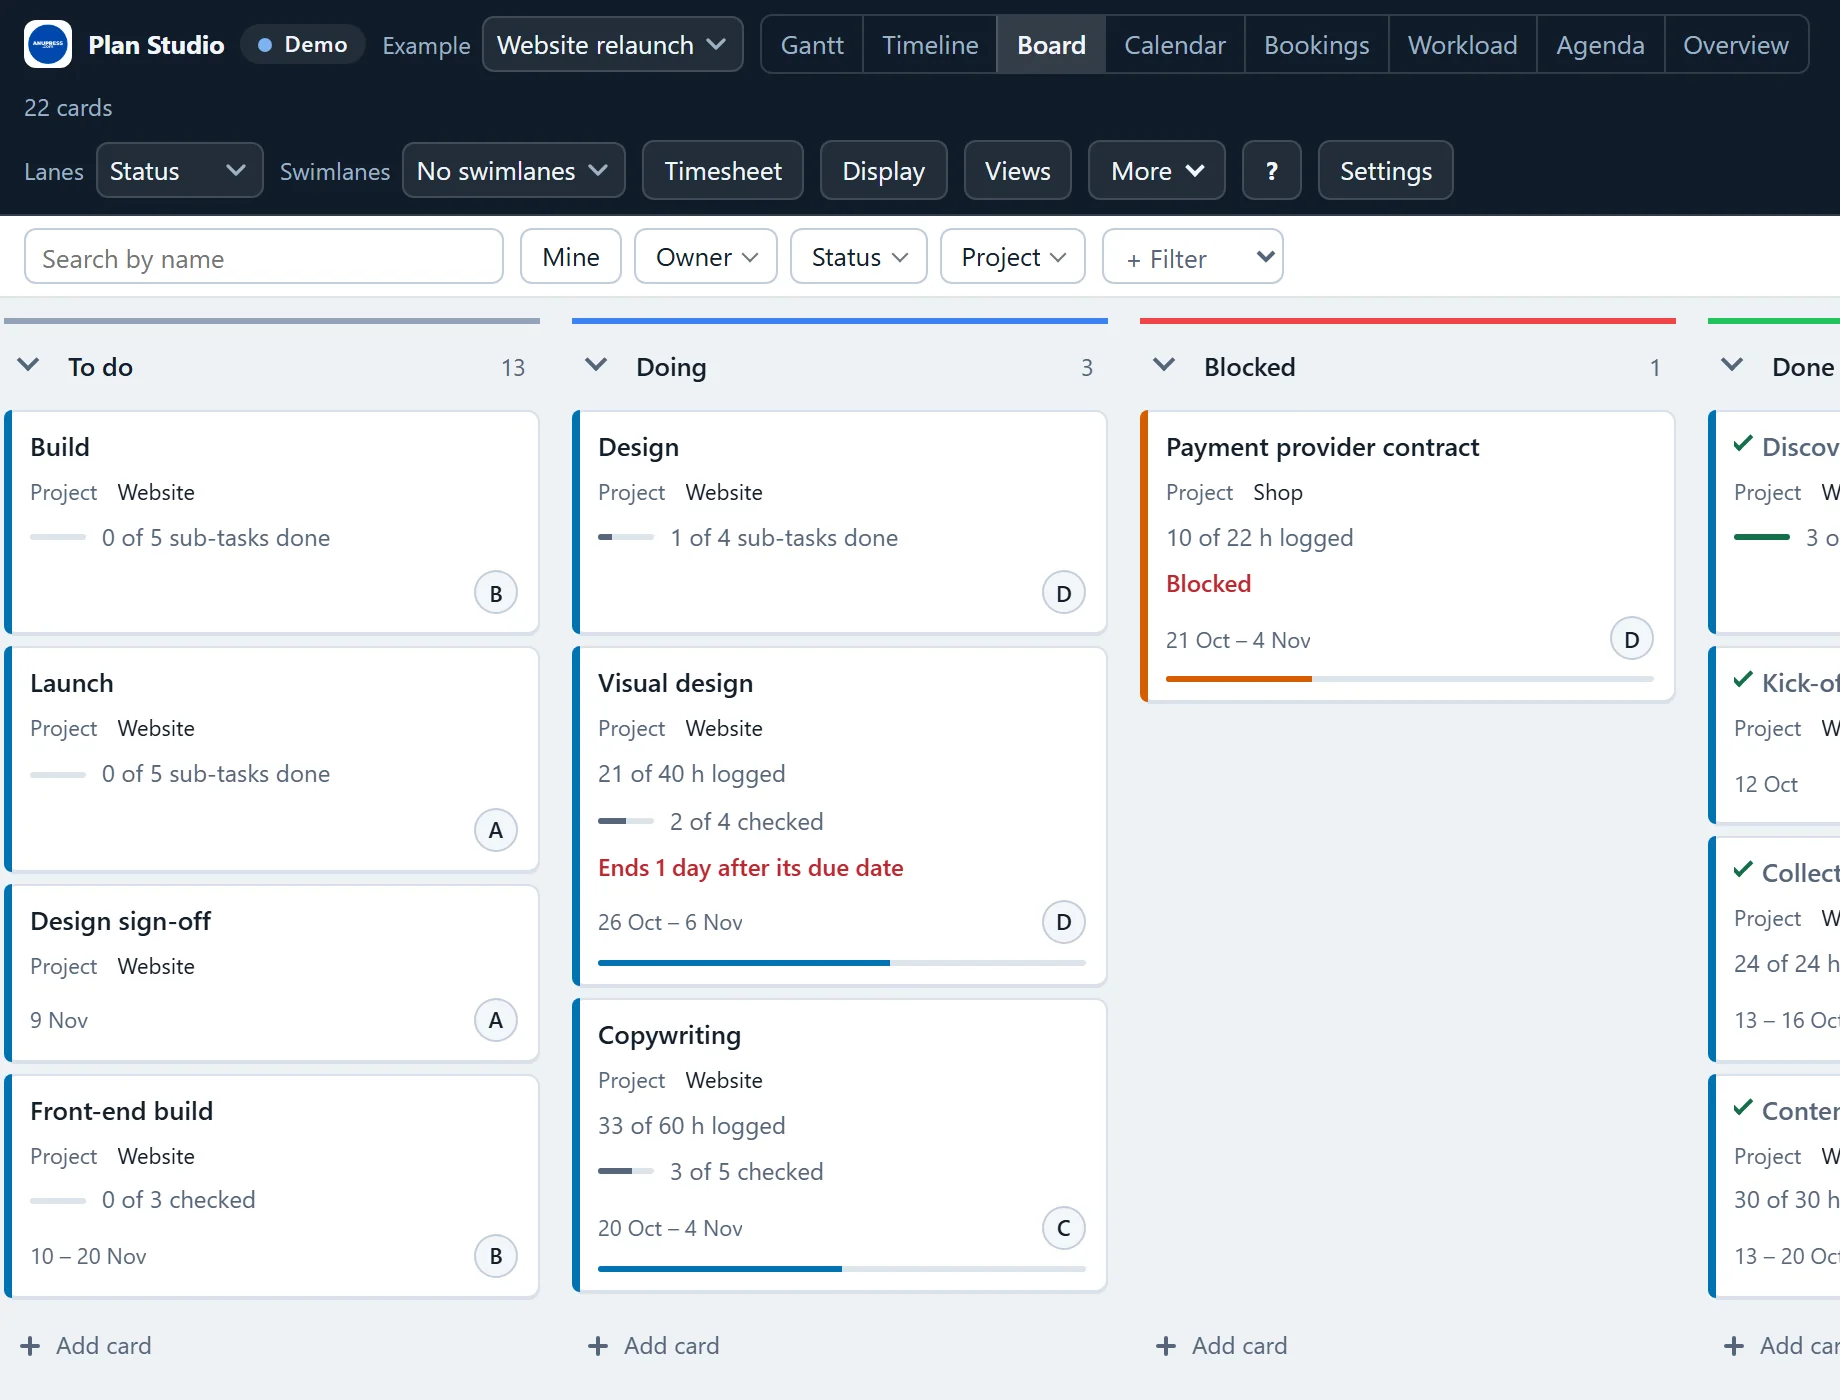
Board: a lane for each status
Drag a card to another lane and its status changes in the table. Swimlanes split every lane into rows, one for each person or project. A lane can have a limit and can fold to a strip.
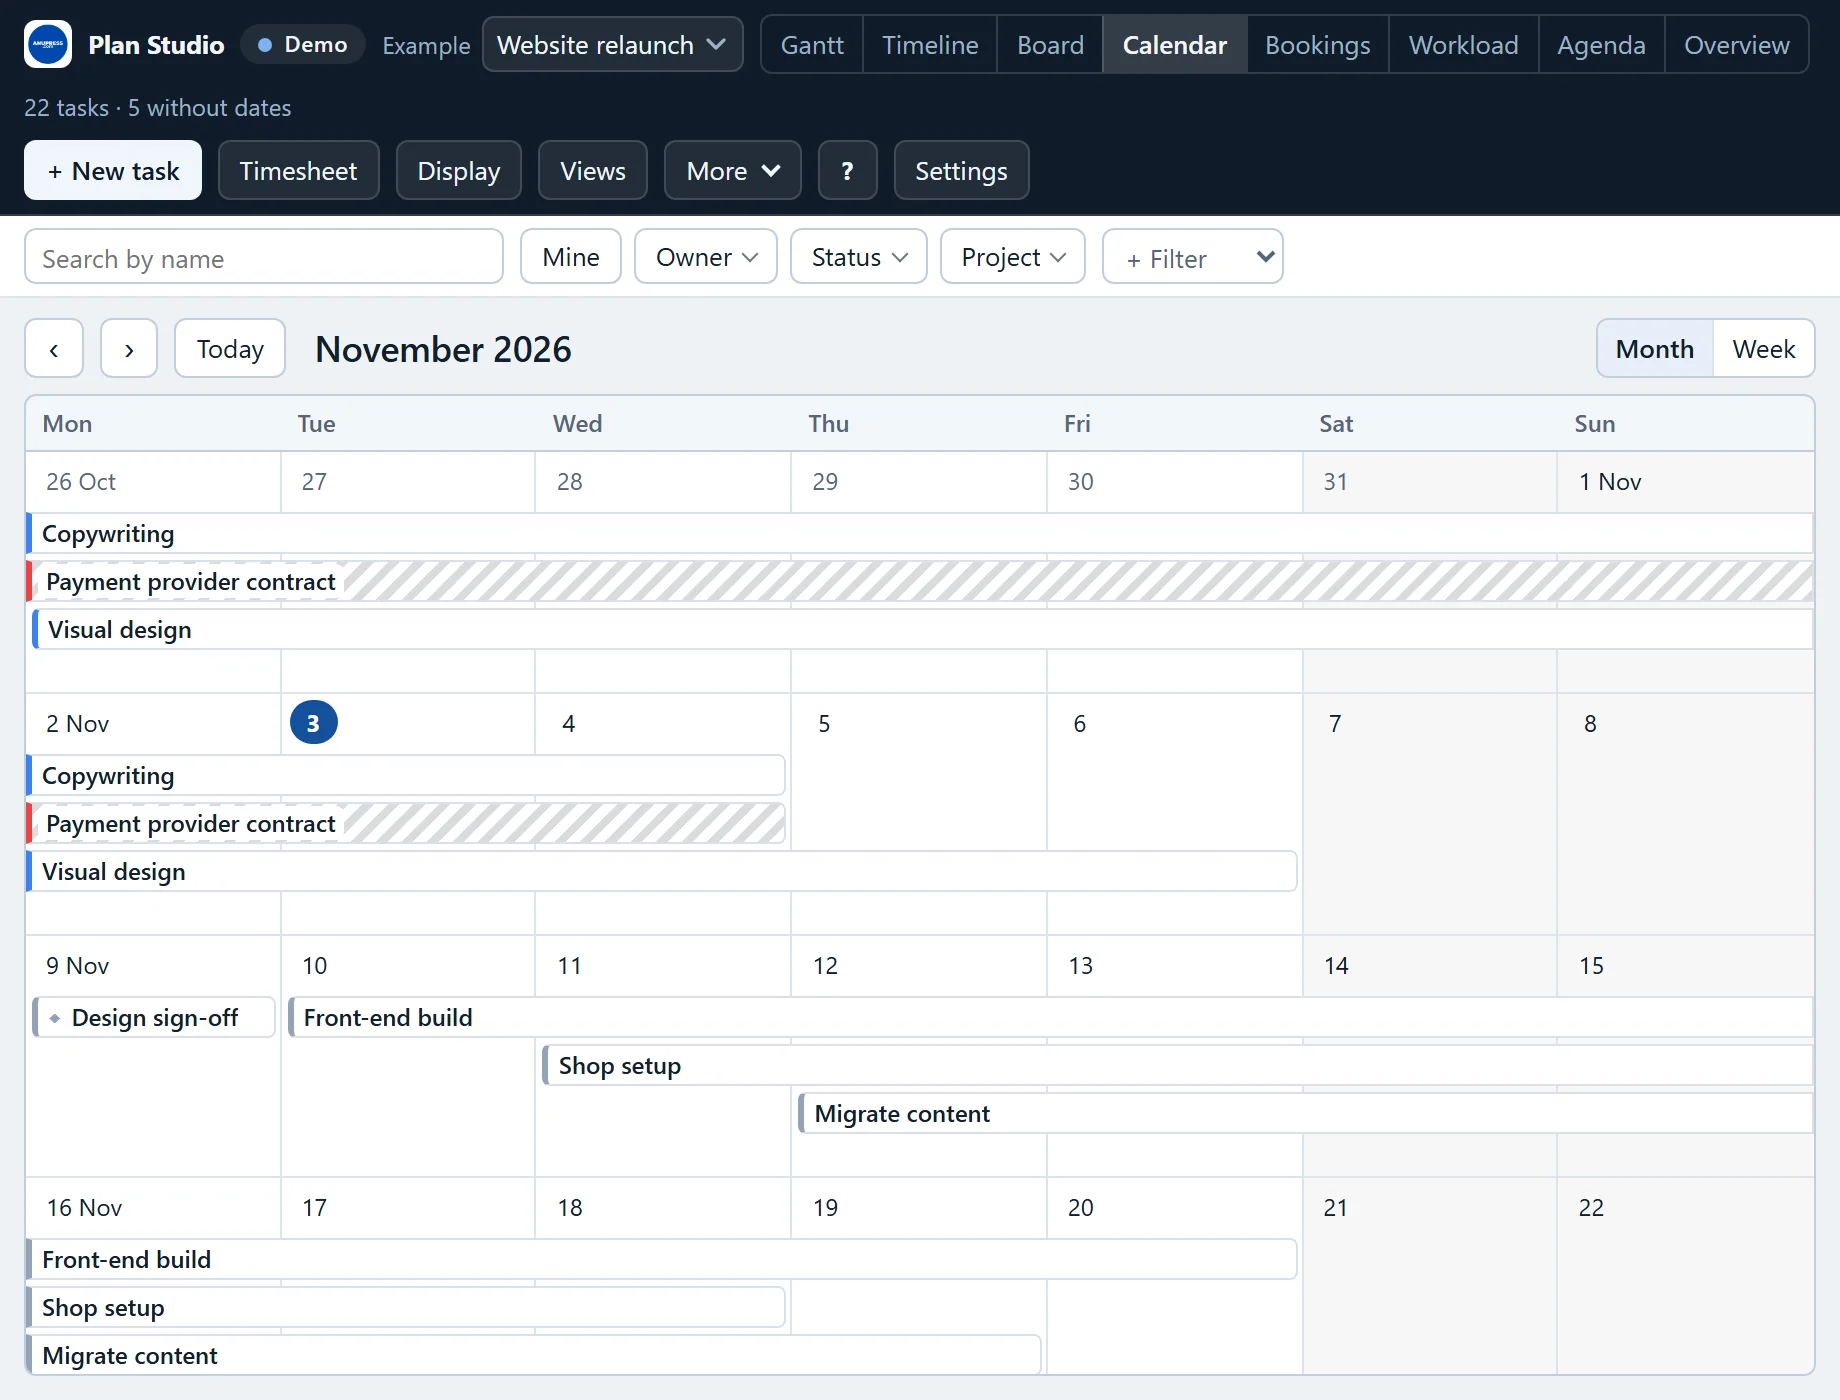
Calendar: the month at a glance
A month or a week, with a bar for each task on the days it covers. Drag a bar to another day and it keeps its length, drag its edge to change its start or end, or drag across empty days to add a task. A move follows the same rules as in the Gantt chart: a formula date refuses, and the tasks that wait are asked about.
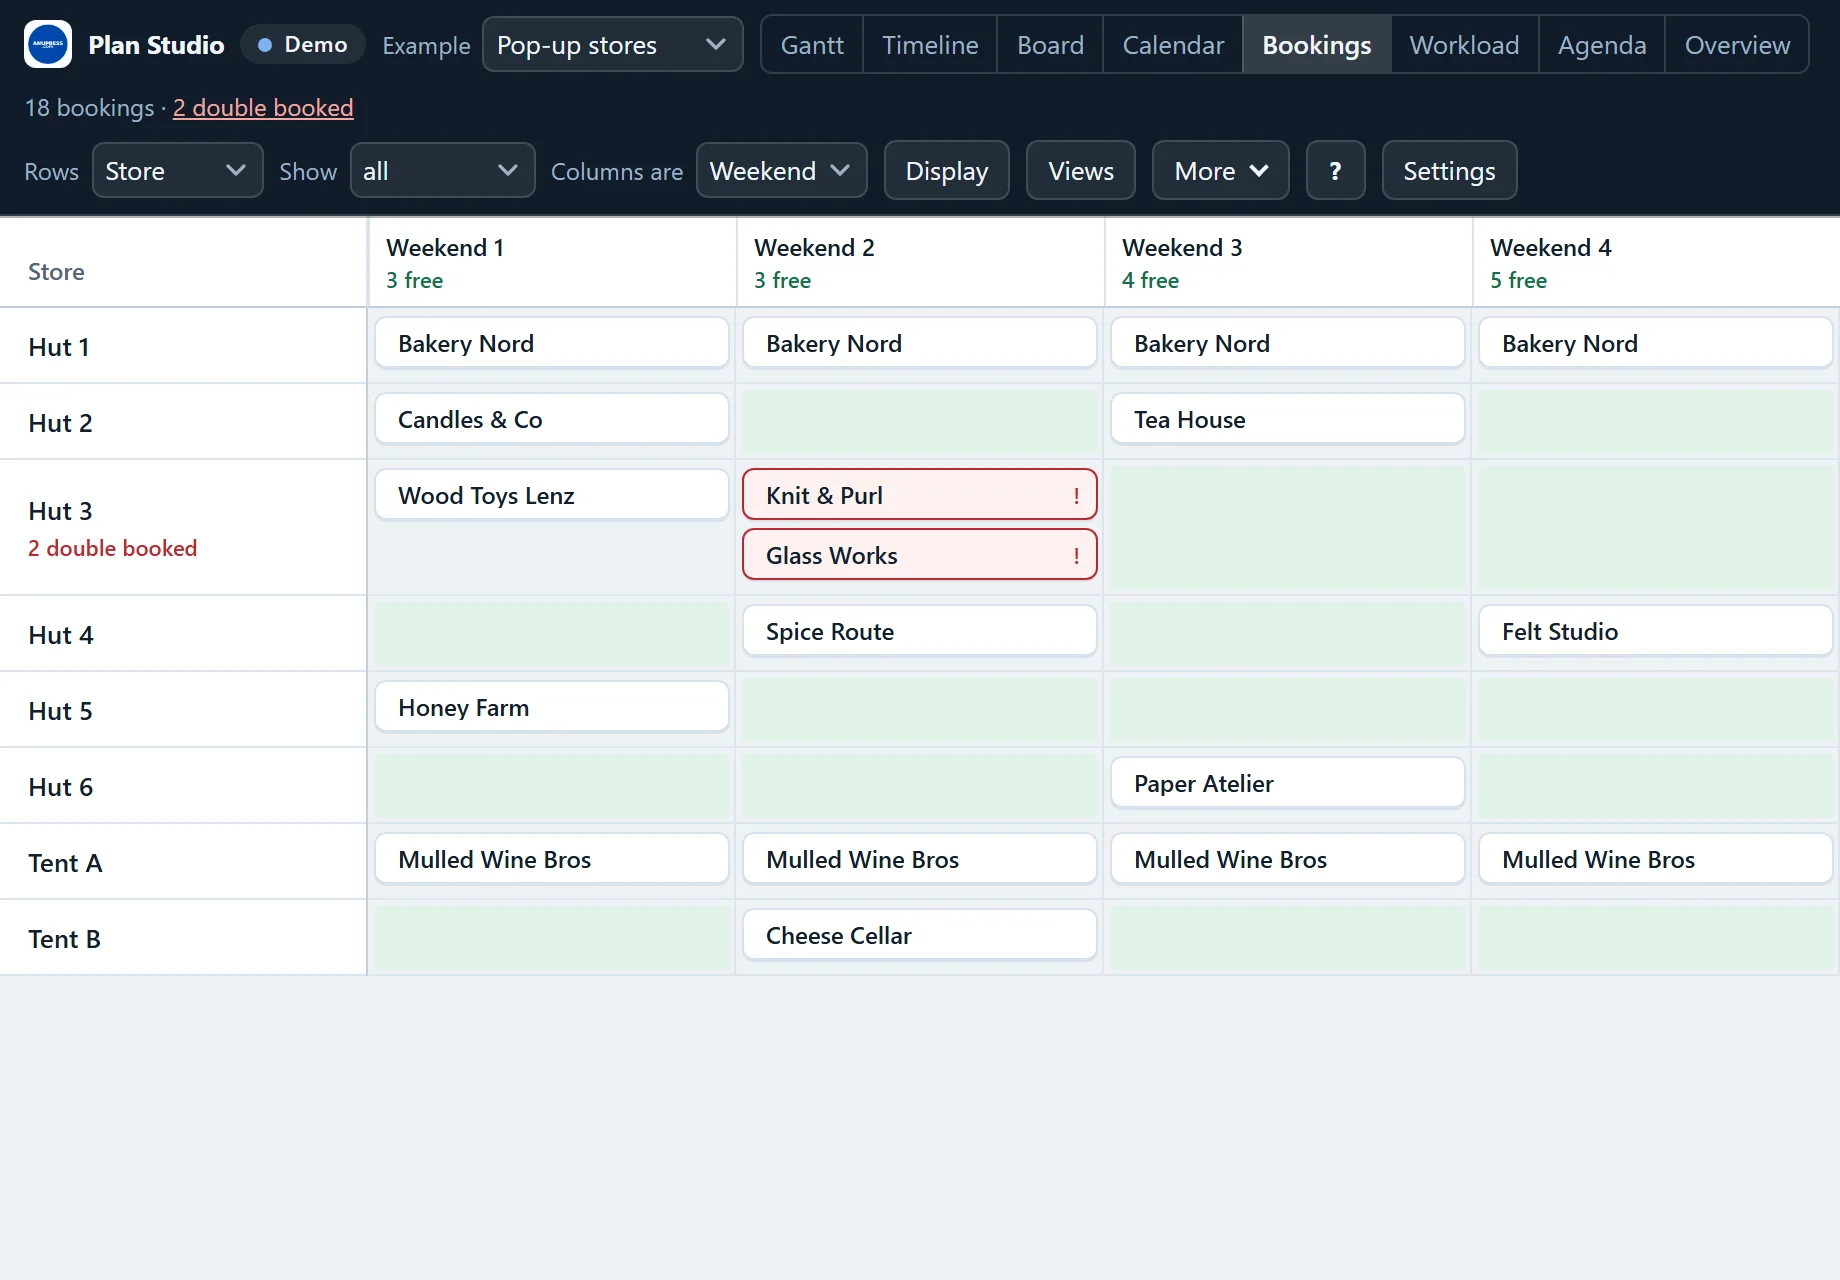
Booking grid: who or what is free
Resources against days, weeks, months or periods of your own, such as market huts against weekends or rooms against days. Each period says how many cells are free, a click on a free cell books it, and a double booking is marked in words. It works on a table with no dates at all.
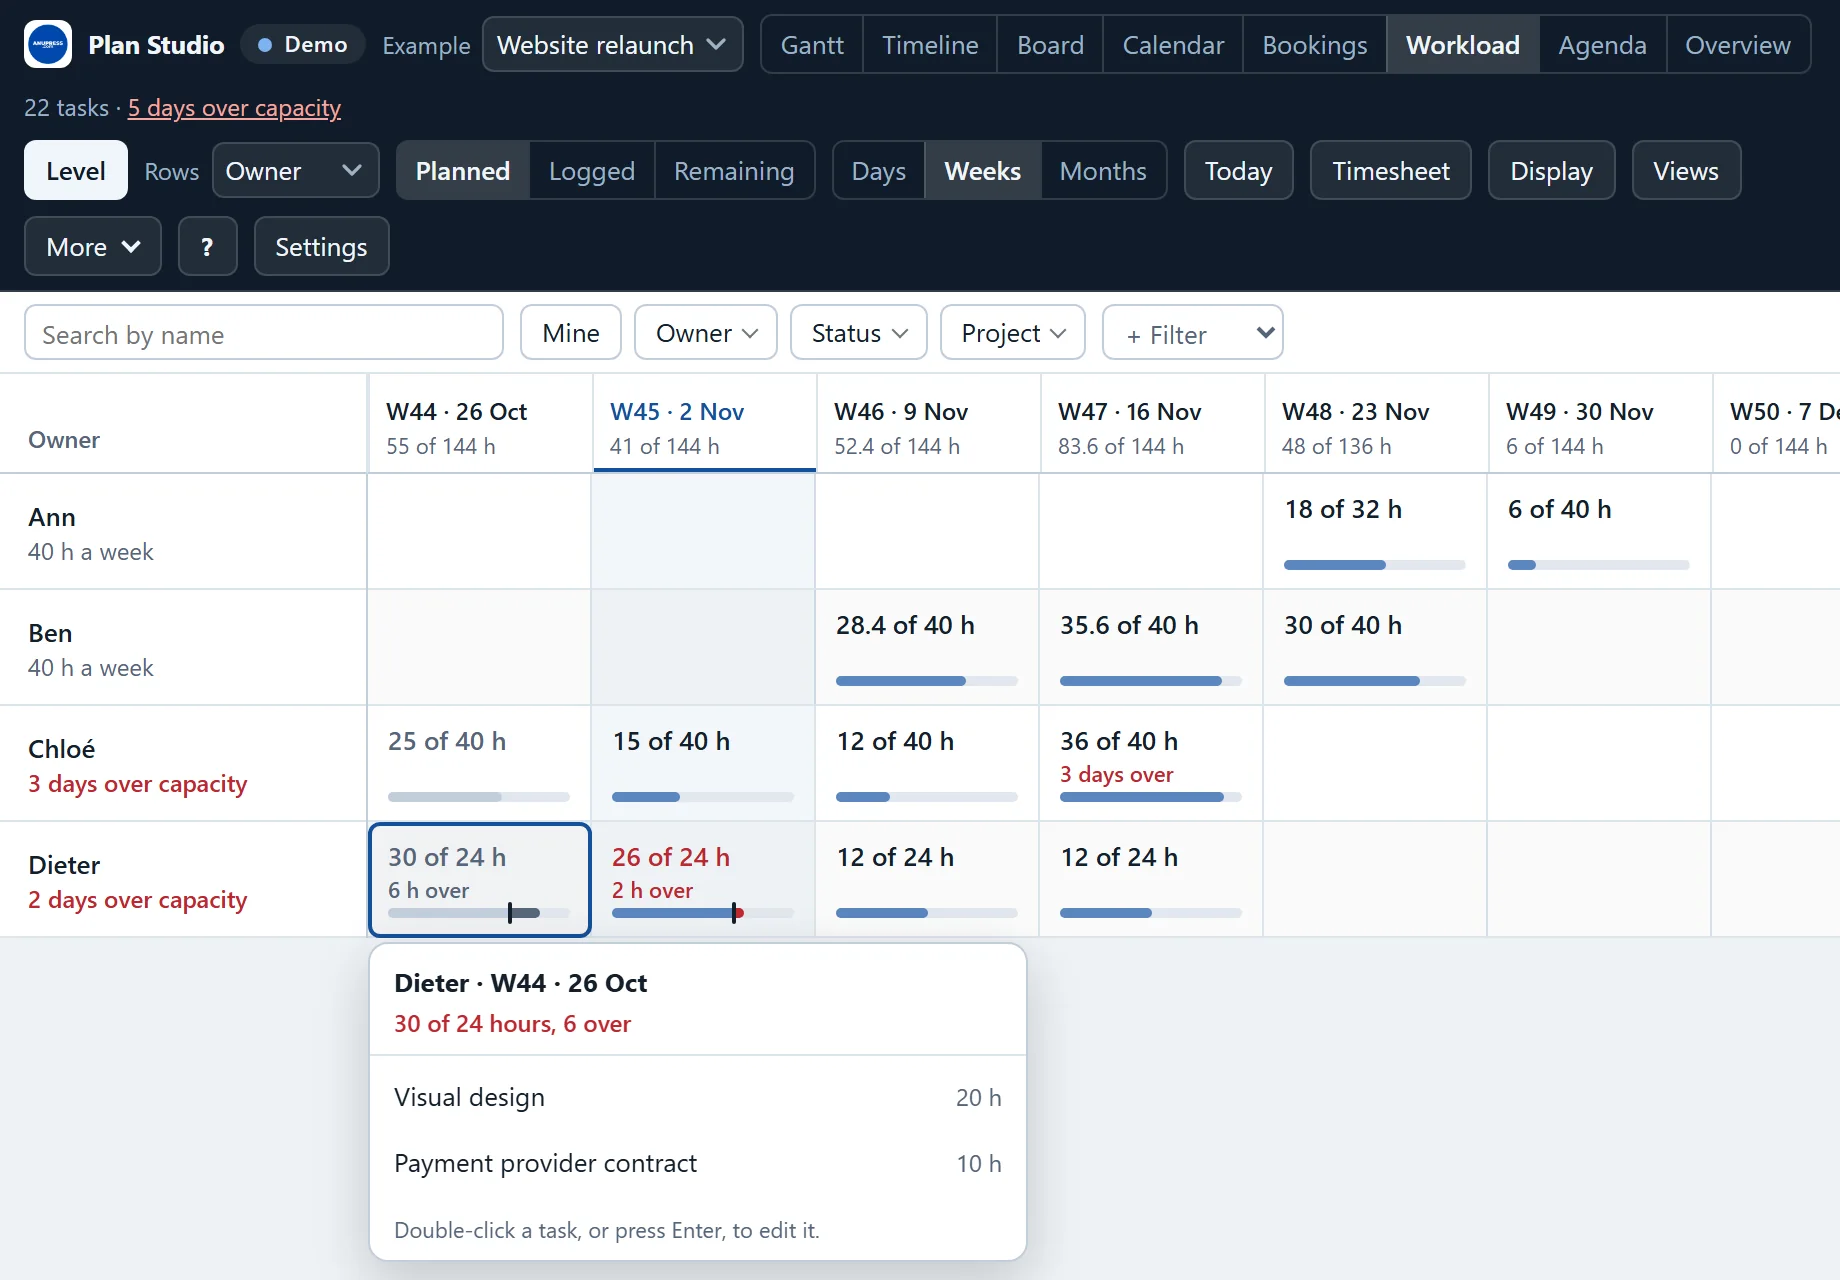
Workload: who has more work than hours
People against weeks: the hours asked of each person against the hours they have. Hours come from an Hours column; capacity is 8 hours a working day, or what the people table says. A cell over capacity says by how much, and a click lists the tasks behind it. Level moves tasks later, each inside its slack, until nobody has too much or the slack runs out. You see the moves first, and one Undo takes them all back.
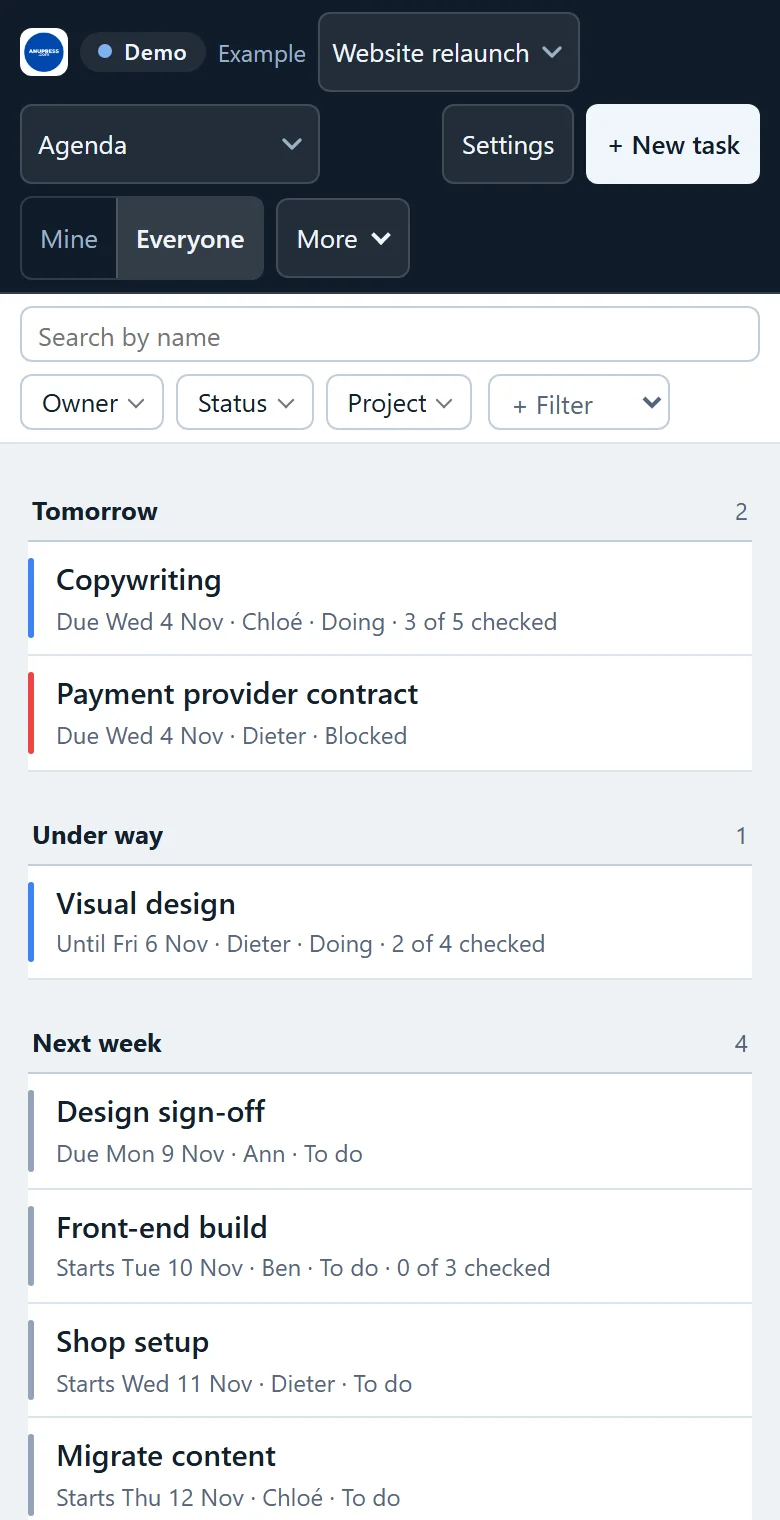
Agenda: the first view on a phone
The open tasks under the day they next need someone: late first, with how many days, then today, tomorrow, under way, this week, next week and later. Mine shows your own tasks and Everyone all of them.
Under 600 pixels wide, the agenda is the first view, and the toolbar folds into one menu and the controls a thumb can hit.
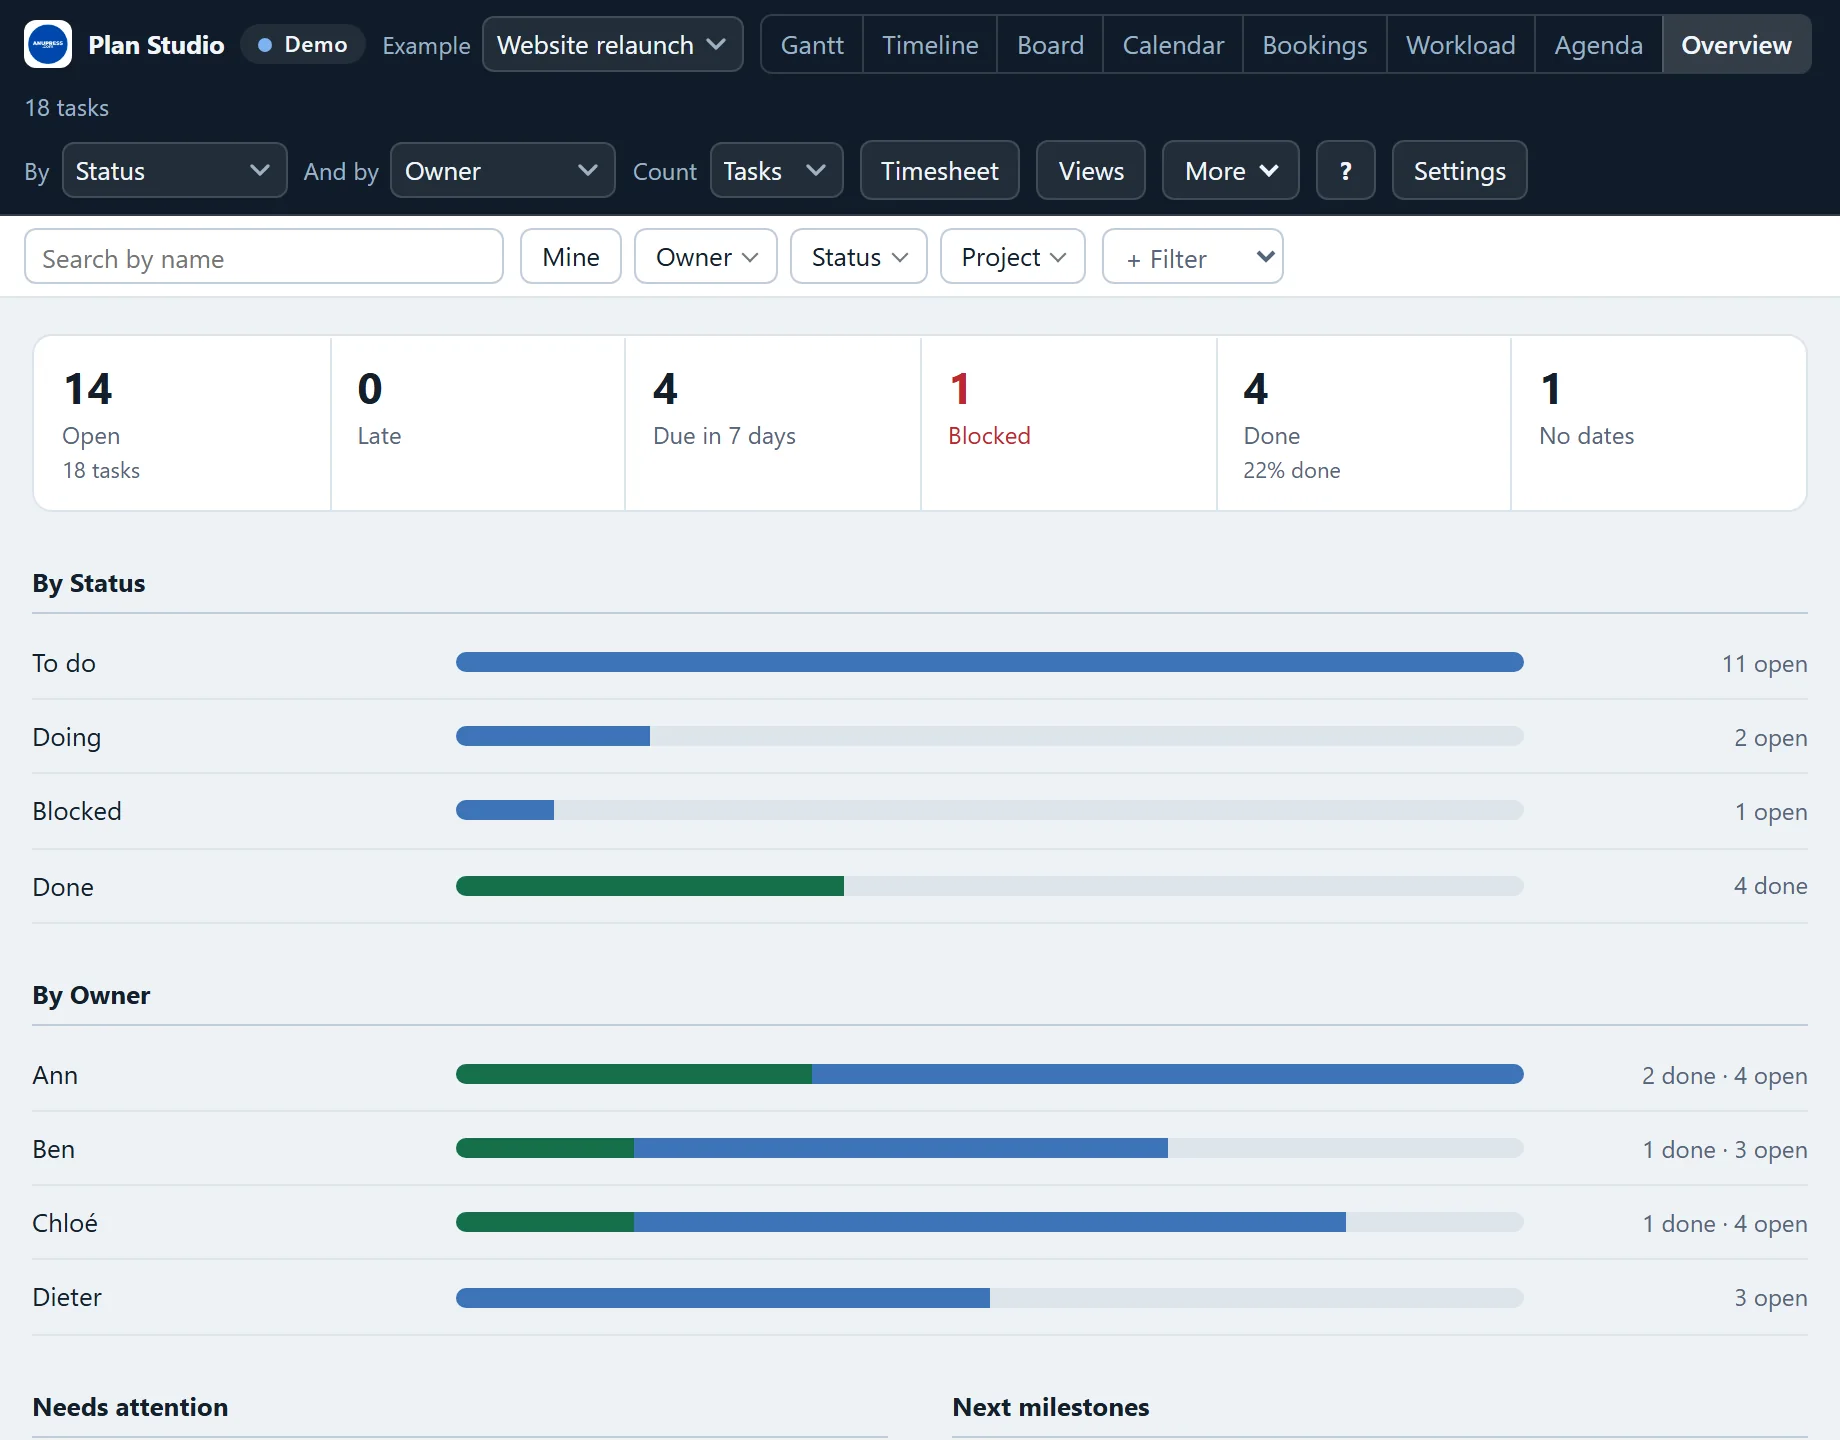
Overview: the plan in numbers
For a lead or a sponsor: how many tasks are open, late, due in the next seven days, blocked and done. Below that, a bar for each status and each person, split into done, open and late, with the same numbers in words. Click a value and the view you came from opens with that filter on. Print makes a one-page report of it.
Groups, filters and saved views
Group puts the rows of the Gantt chart under headings, by person, status, project or any other column, and then lets each heading hold groups of its own. Each heading folds.
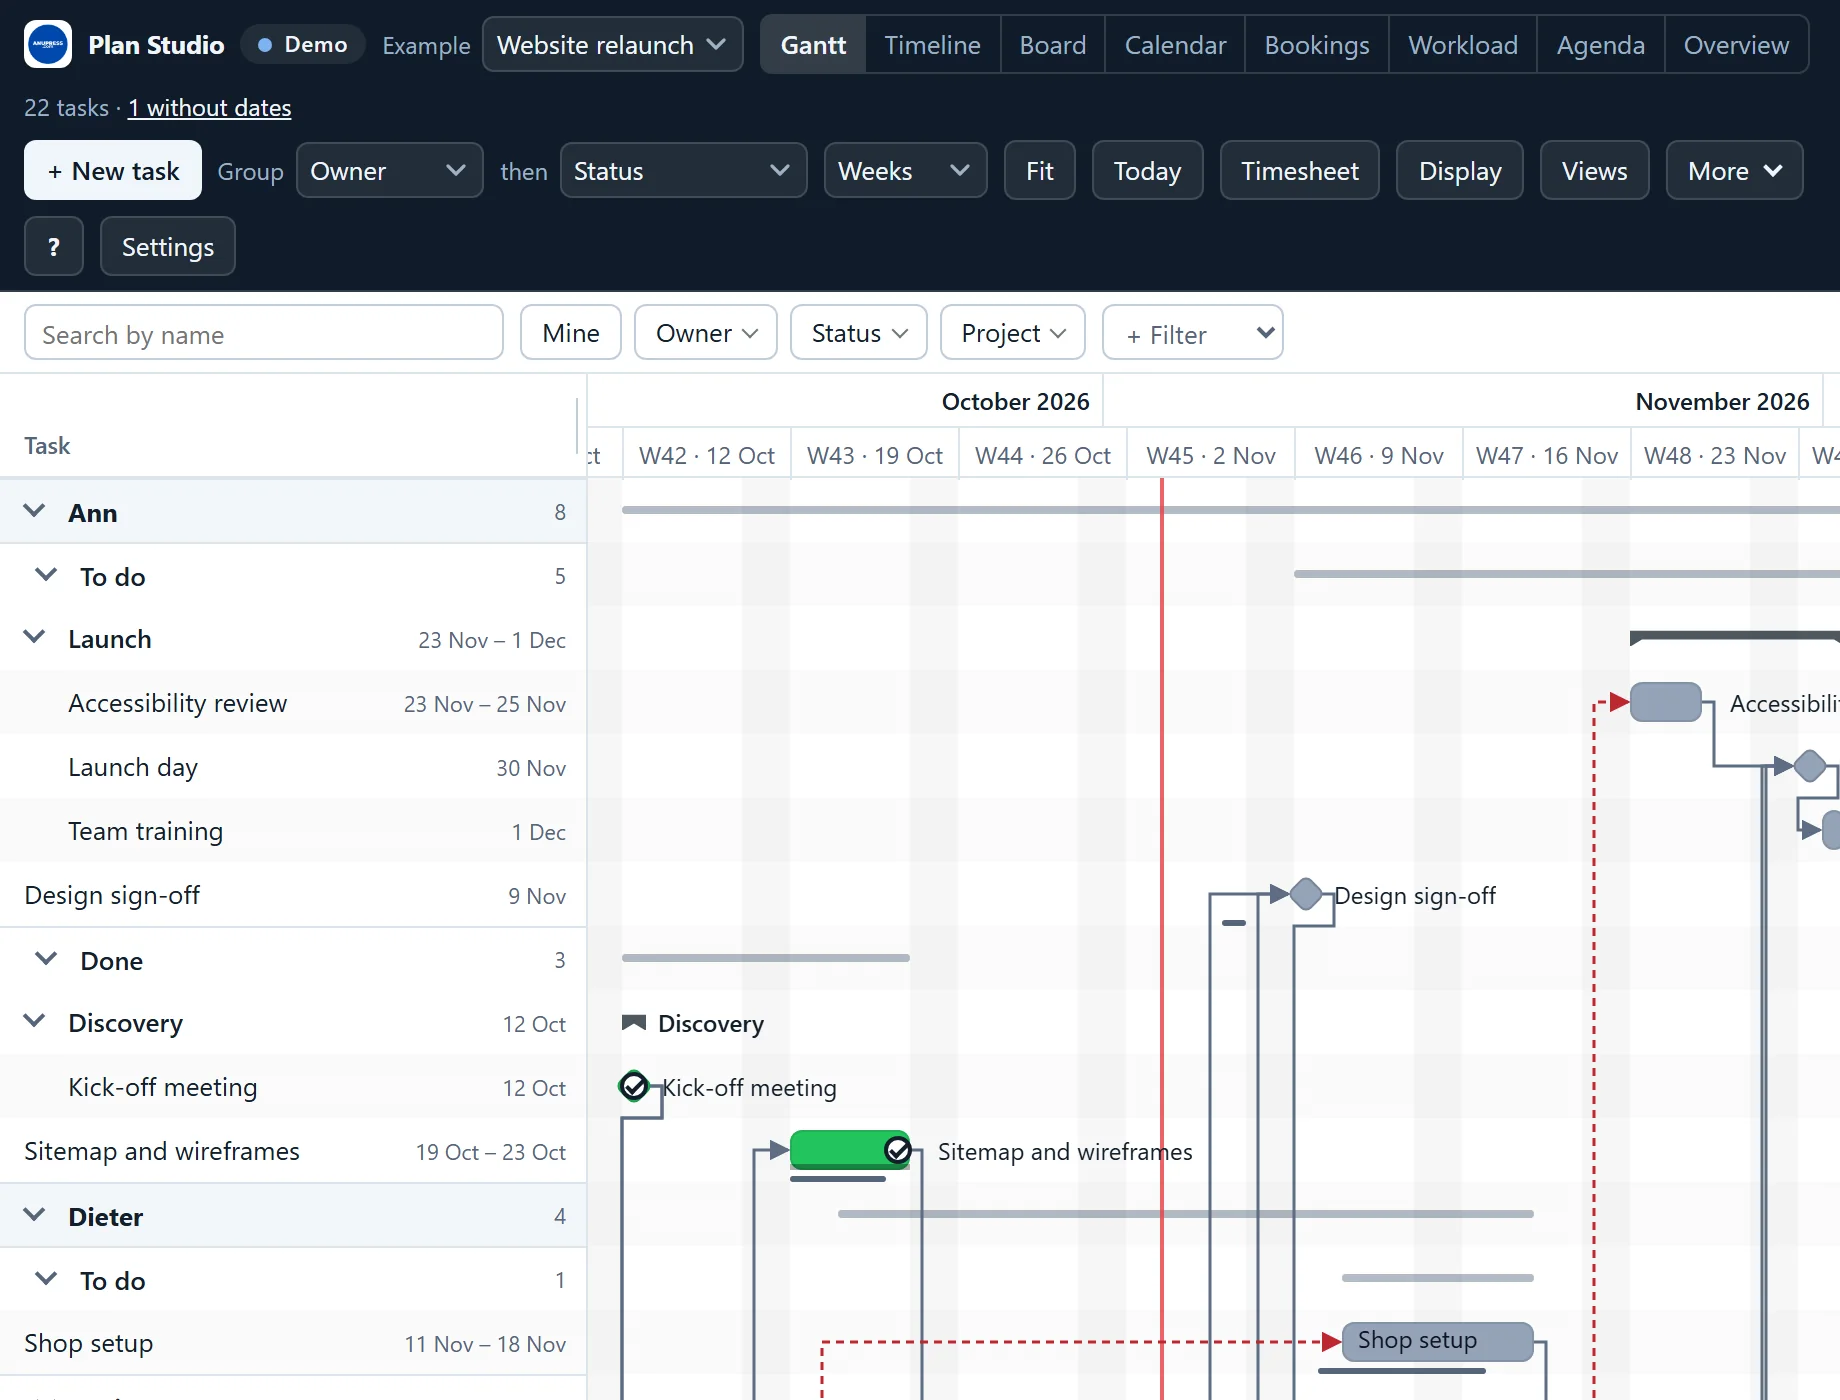
The search keeps the tasks whose name has the words you type. Next to it is a chip for the person, the status and the project, and + Filter adds one for any other column. The strip says what is shown, such as “7 of 22 shown”, and Clear filters brings everything back. Filters decide what a view draws and write nothing to the table.
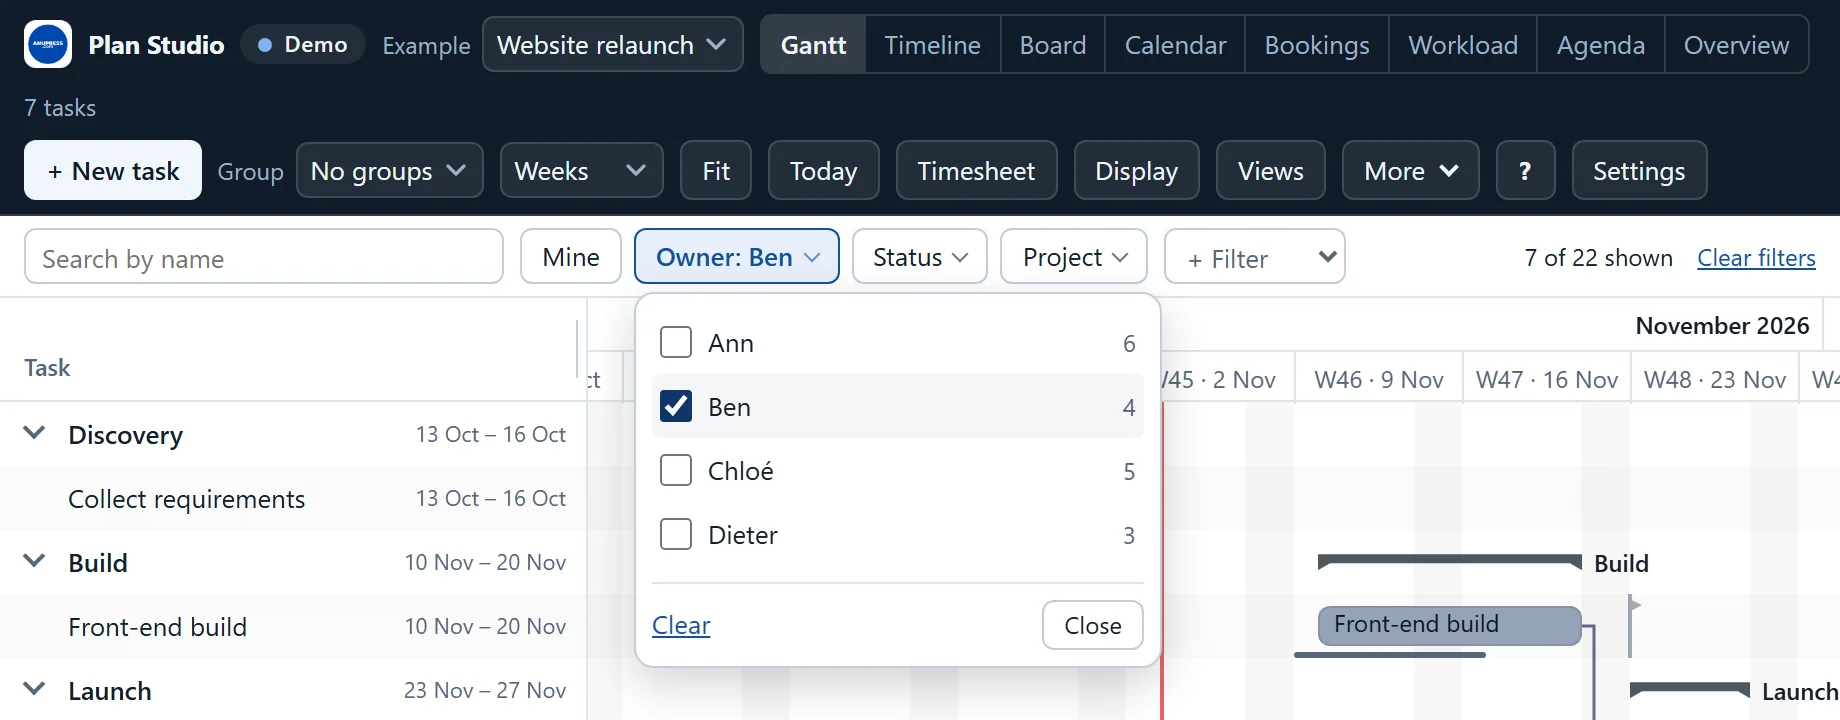
Display changes the look: compact rows, colour by any column, names in or beside the bars, week numbers, weekends, and up to three columns next to the names in the Gantt chart. It stays in your browser. Views saves all of it under a name: the view, the zoom, the groups, the filters and the look. A click applies a saved view, and everyone who opens the page sees the list once someone presses Grist’s own Save at the top right of the widget.
Several tasks at once, copies and lists
- Select several: Ctrl and a click adds a task, Shift and a click selects a range, and Shift and a drag draws a box in the Gantt chart. A strip says how many are selected and offers Mark done, Set…, Move dates… and Delete…, each one step in Undo.
- Copy… makes a task again later, or every few days, weeks or months: “every Monday until the end of the year”. The copies start over, not started and with no progress.
- Add several tasks (in More) takes a list, typed or pasted from a mail. A line indented under another becomes its sub-task, and the tasks can follow one another.
- The menu on a task: right-click a bar, a row or a card. More also has Copy as text and Download as CSV.
Time tracking and the timesheet
Hours worked go in a table of their own, a row per entry, with the task, the person, the day and the hours. Settings → More → Time tracking adds that table after asking.
- Start timer in a task’s edit window starts a timer that lives in the document, so it keeps running through a reload or a closed laptop. The toolbar shows it, with Stop.
- A card, the edit window and a bar’s tooltip in the Gantt chart say how much is logged against the plan: “21 of 40 hours logged, 19 left”.
- The workload shows Planned, Logged or Remaining hours.
- Timesheet shows one person’s week, or everyone’s: a row per task, the hours of each day and the totals. Download CSV hands the week to a spreadsheet.
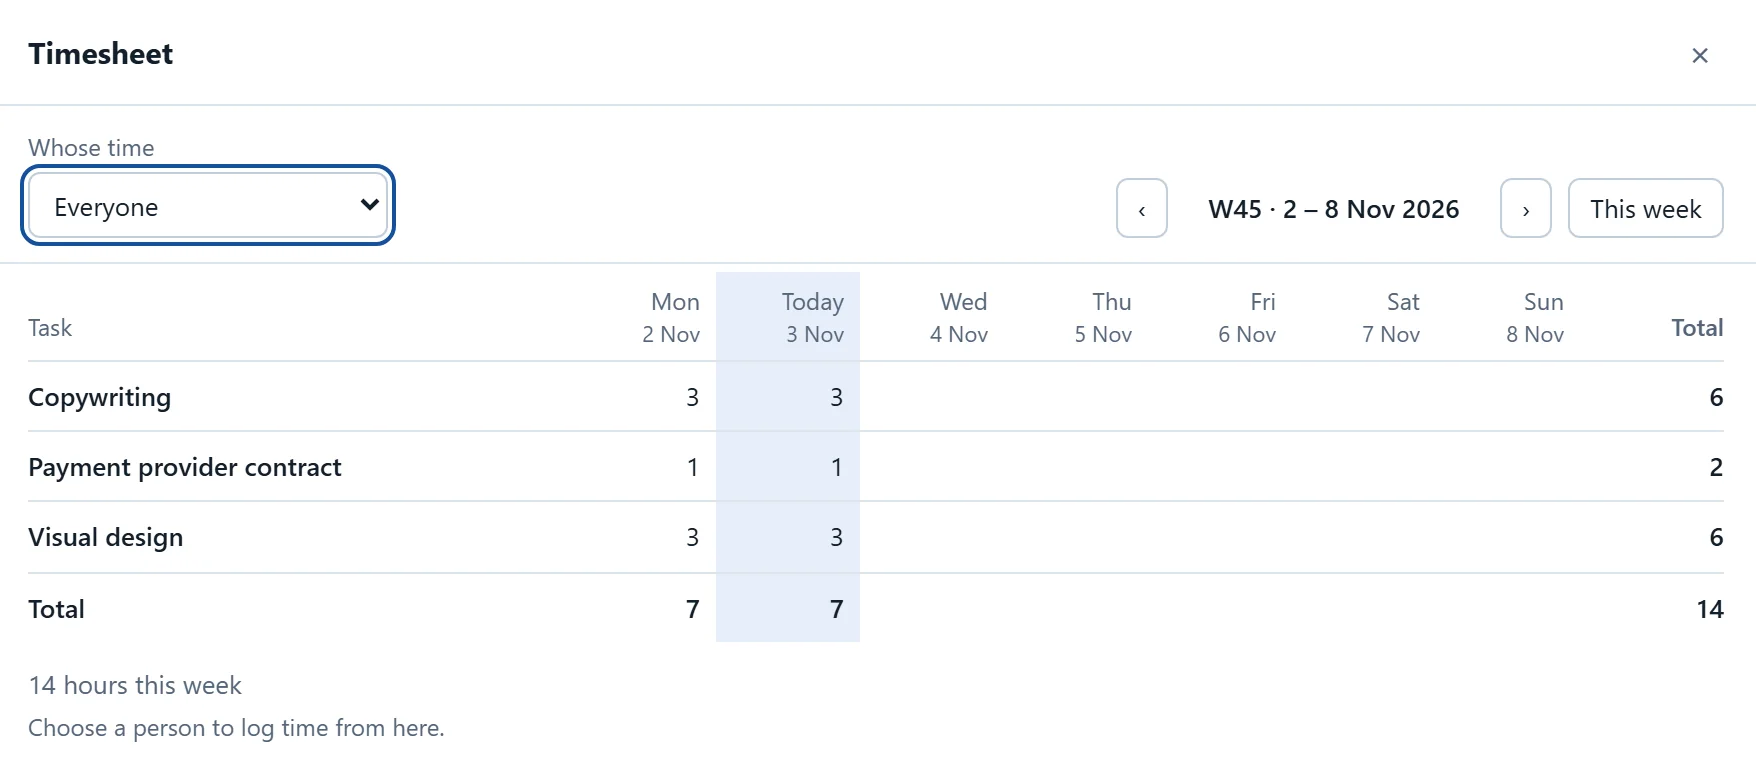
Grist does not tell a widget who is signed in, so Plan Studio asks whose timer it is the first time and remembers the answer in this browser.
Calendar files, reminders and printing
- Add to calendar, in the agenda or a task’s edit window, downloads an .ics file with the reminder you choose: 9:00 the day before, 9:00 on the day, 9:00 three days before, or none. Importing it again updates the events instead of adding copies.
- Email reminders writes a short Google Apps Script that runs in your own Google account every morning and emails each person the tasks that are late or due soon. Your Grist API key goes into Google’s editor, never into Plan Studio. Google allows a free account 100 email recipients a day and a Workspace account 1,500 (Apps Script quotas).
- Print (or Ctrl+P in the widget) prints the view on show on wide A4 or A3 pages. A Gantt chart either fits the page width or keeps its zoom in page-wide slices, and rows never split across a page. Save as PNG draws the same layout as a picture. The agenda has no printout.
Where your plan goes
Plan Studio is a static page on GitHub Pages that runs in your browser. It reads your table through Grist’s widget API and writes changes back the same way. ANUPRESS runs no server and receives nothing, and the widget makes no network requests of its own. The column mapping, the options and the saved views are kept in the document, once someone presses Grist’s Save. The zoom, the groups, the filters and Display stay in your browser. The code is MIT licensed and public, so anyone can check this.
What Plan Studio cannot do
- A task needs a date to appear in the Gantt chart. One without dates sits under “1 without dates” in the toolbar until you give it some, for example with a drag across its row.
- Files are read only. Plan Studio shows a task’s files; it does not add, rename or remove them.
- Level stays inside the slack. It never moves the end of the plan, so an overload that needs more time stays, and the dialog says how many days are still over.
- Formula columns are never written, so a date that comes from a formula cannot be dragged.
- It does not know who is signed in. Grist does not tell a widget, so Mine and the timer ask once per browser.
- Browsers: we test in Chrome, and Save as PNG only there. Firefox and Safari have not been tested.
- German and French: the interface speaks both, following Grist’s language, but no native speaker has read it yet.
Grist Gantt chart: FAQ
Is Plan Studio free?
Yes. Plan Studio is open source under the MIT licence and hosted on GitHub Pages. There is no account, no tier and no usage limit. Grist itself has a free plan and can be self-hosted.
Does it need its own tables or columns?
No. It reads the table you choose and works out which columns hold the name, the dates, the status and the person. Grist’s Project Management, Lab Project Management, Rental Management and Content Calendar templates need no setup. When a part of a task has no column, Settings offers to add one, and asks first.
Does it change my table?
Only when you do something: drag a bar, save the edit window, link two tasks or add one. Each change is one Grist action that one Undo takes back. Formula columns are never written. Looking around, searching, filters and Display write nothing.
Does my plan leave my Grist document?
No. The widget is a static page that runs in your browser. It reads and writes your document through Grist’s widget API, and it makes no network requests of its own. ANUPRESS runs no server and receives nothing.
Can it show the photos and files of a task?
Yes, when the table has an Attachments column. Point at a bar in the Gantt chart or the timeline, or at a booking, and the tooltip shows the first three files: a small picture for each photo or drawing, and the type for the rest. The edit window lists up to twelve, larger. Plan Studio only reads them; you add files in Grist or with File Studio.
Why did Grist not keep my saved view?
Saved views and Settings are the widget’s options. Grist holds a change of them as an unsaved change of the widget, with a green Save at the widget’s top right. Press it, and everyone who opens the page gets the view. A reload before that loses it, and Grist asks first.
Does it work on a phone?
Yes. Under 600 pixels wide the agenda opens first: late tasks, today, tomorrow and the weeks ahead, with Mine or Everyone. The toolbar folds into one menu and the controls a thumb can hit. A touch drag starts after a short rest, so a swipe still scrolls.
Does it work with self-hosted Grist and Grist Desktop?
Yes. Paste the same address. Grist Desktop works the same; we tested 0.3.16 on Windows. A self-hosted Grist can also list Plan Studio in its Custom widget picker: start it with GRIST_WIDGET_LIST_URL set to https://anupress.github.io/grist-plan-studio/manifest.json.
How big can a plan be?
Plan Studio draws only the rows on screen. In our test of version 1.8, a plan of 2,000 tasks was drawn in about 1.1 seconds.
Keep going
The source, the changelog and the issue tracker are on GitHub. If you would rather have Grist set up for you, with your tables and the widgets in place, that is a service we offer.
Plan Studio is built and maintained by ANUPRESS. It is free, open source, and runs entirely in your browser. The tasks, people and stores in the demo and the screenshots are invented.