Grist dashboard templates: all 10, toured
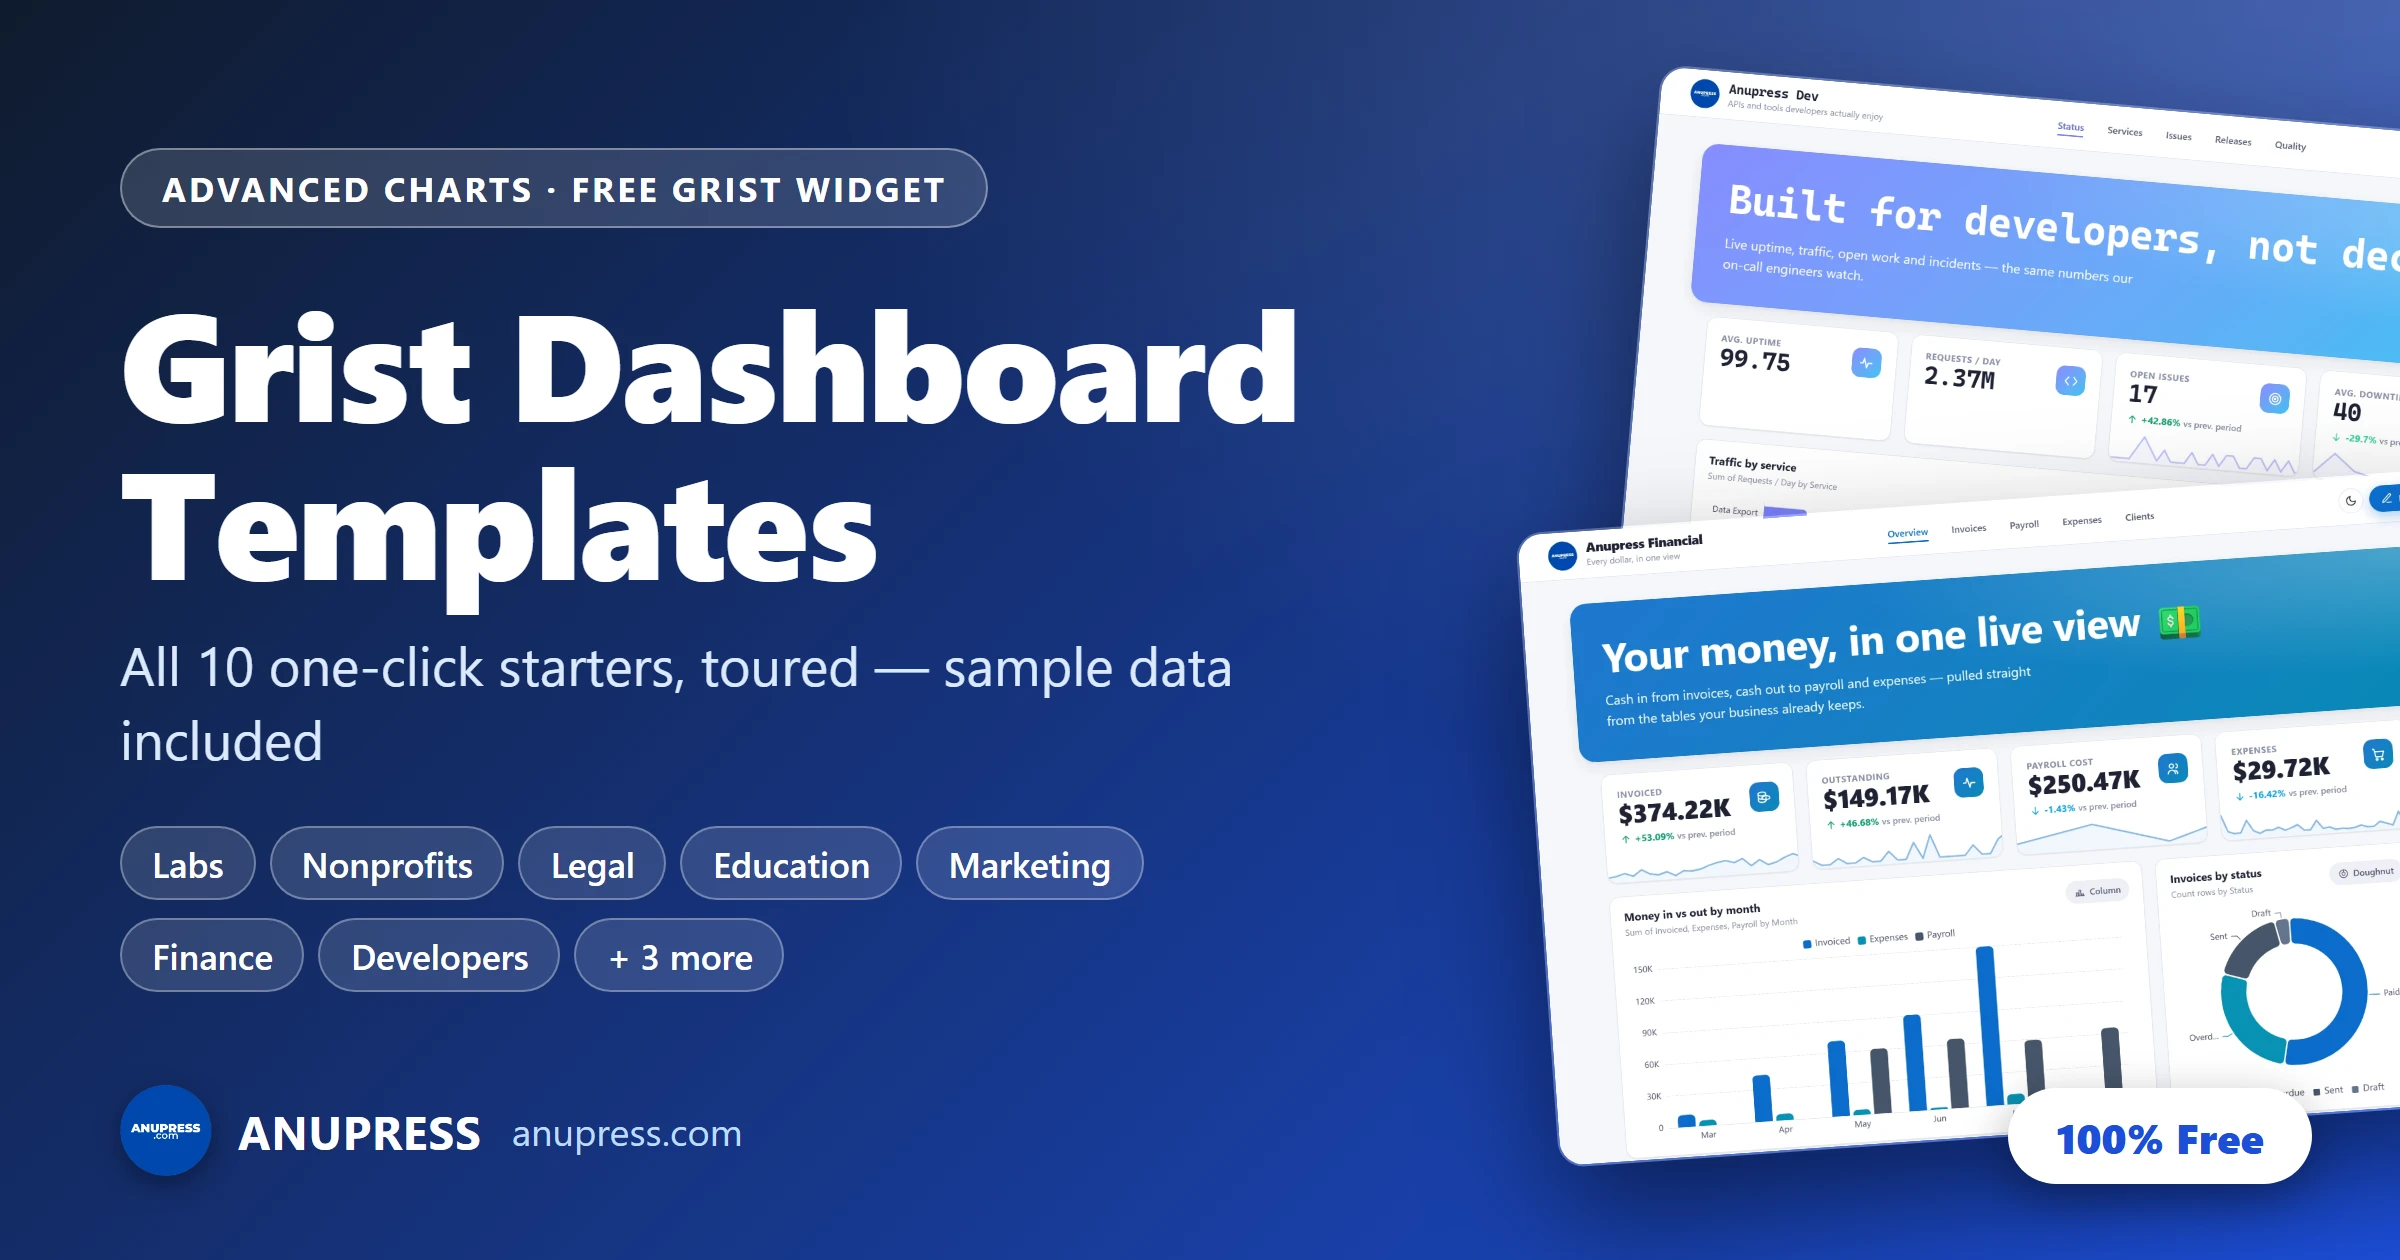
Advanced Charts ships with ten free Grist dashboard templates — finished starting points, not empty shells. One click installs a complete multi‑page dashboard (pages, charts, copy and theme) plus sample tables in your Grist document, so nothing is empty while you make it yours. This is the tour: what each one includes, who it’s for, and how the sample data works.
All of these Grist dashboard templates are free and already inside the widget — there is no marketplace and nothing to download. If you haven’t installed Advanced Charts yet, the five‑minute setup guide comes first; templates are one click away after that.
How Grist dashboard templates work
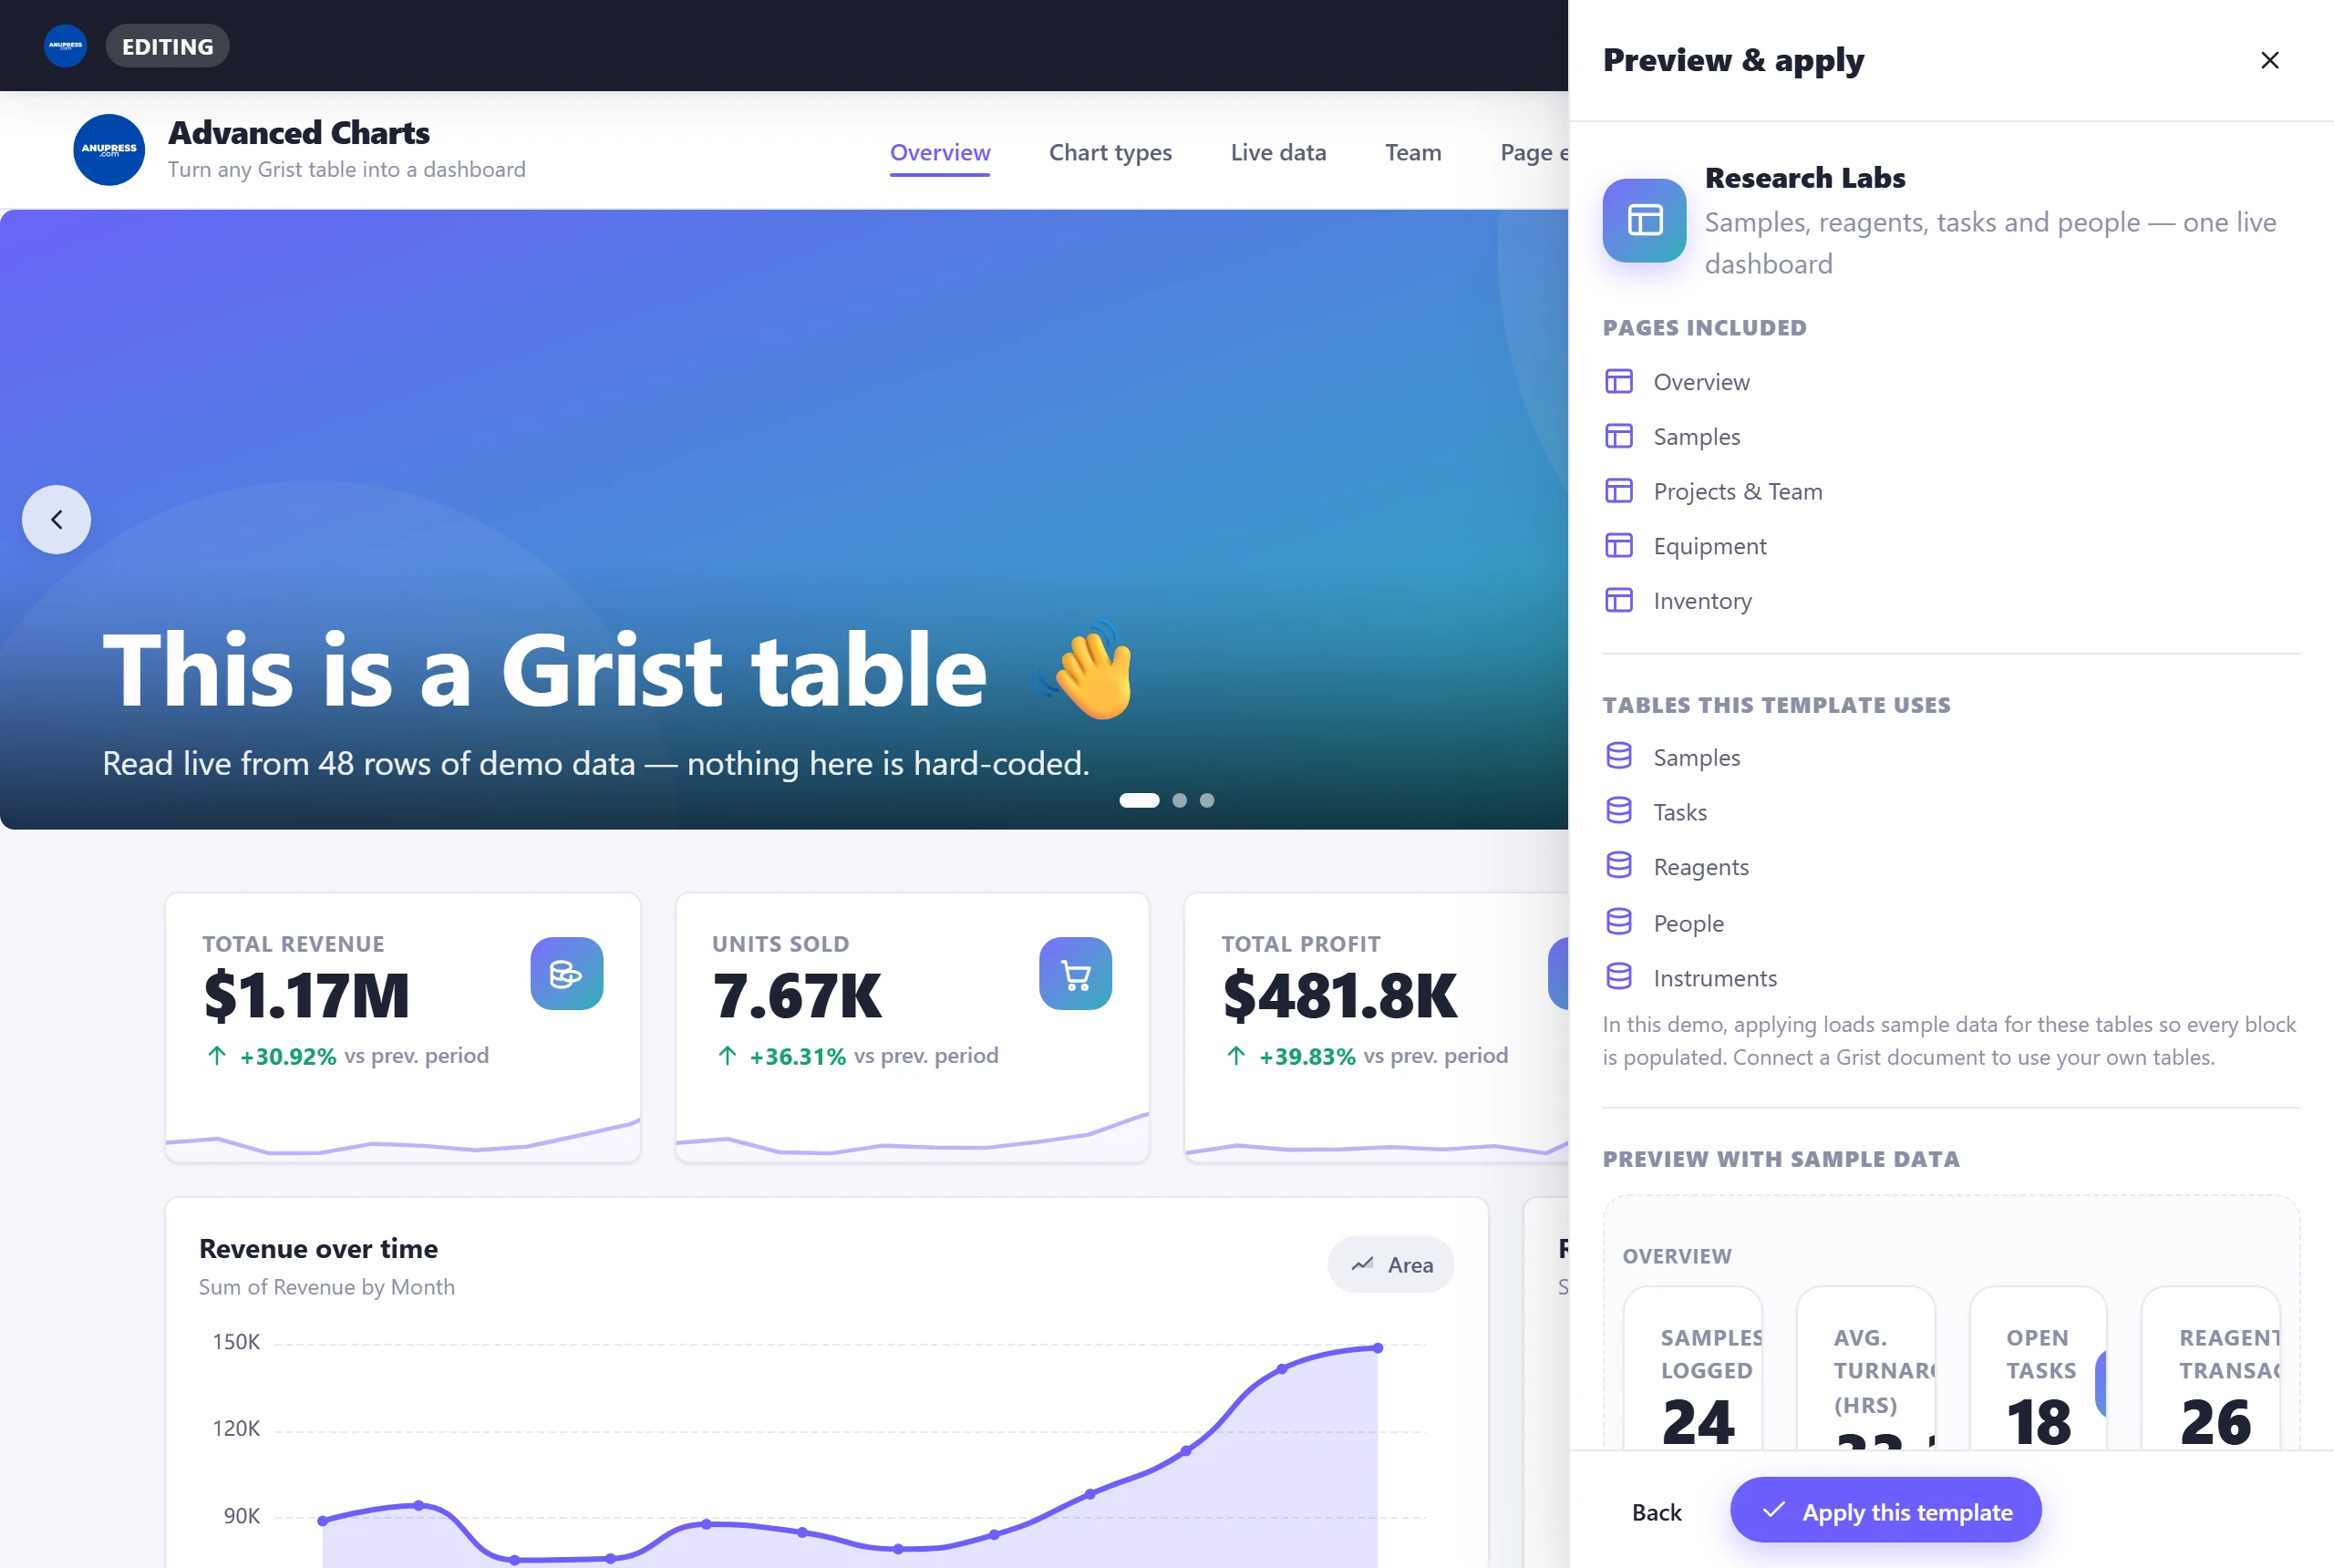
Open Edit → Settings → Templates and pick one. Before anything changes, you see three things: the pages it will install, the tables it uses, and a full preview rendered with that industry’s own sample data — real numbers in real charts, not grey placeholders.
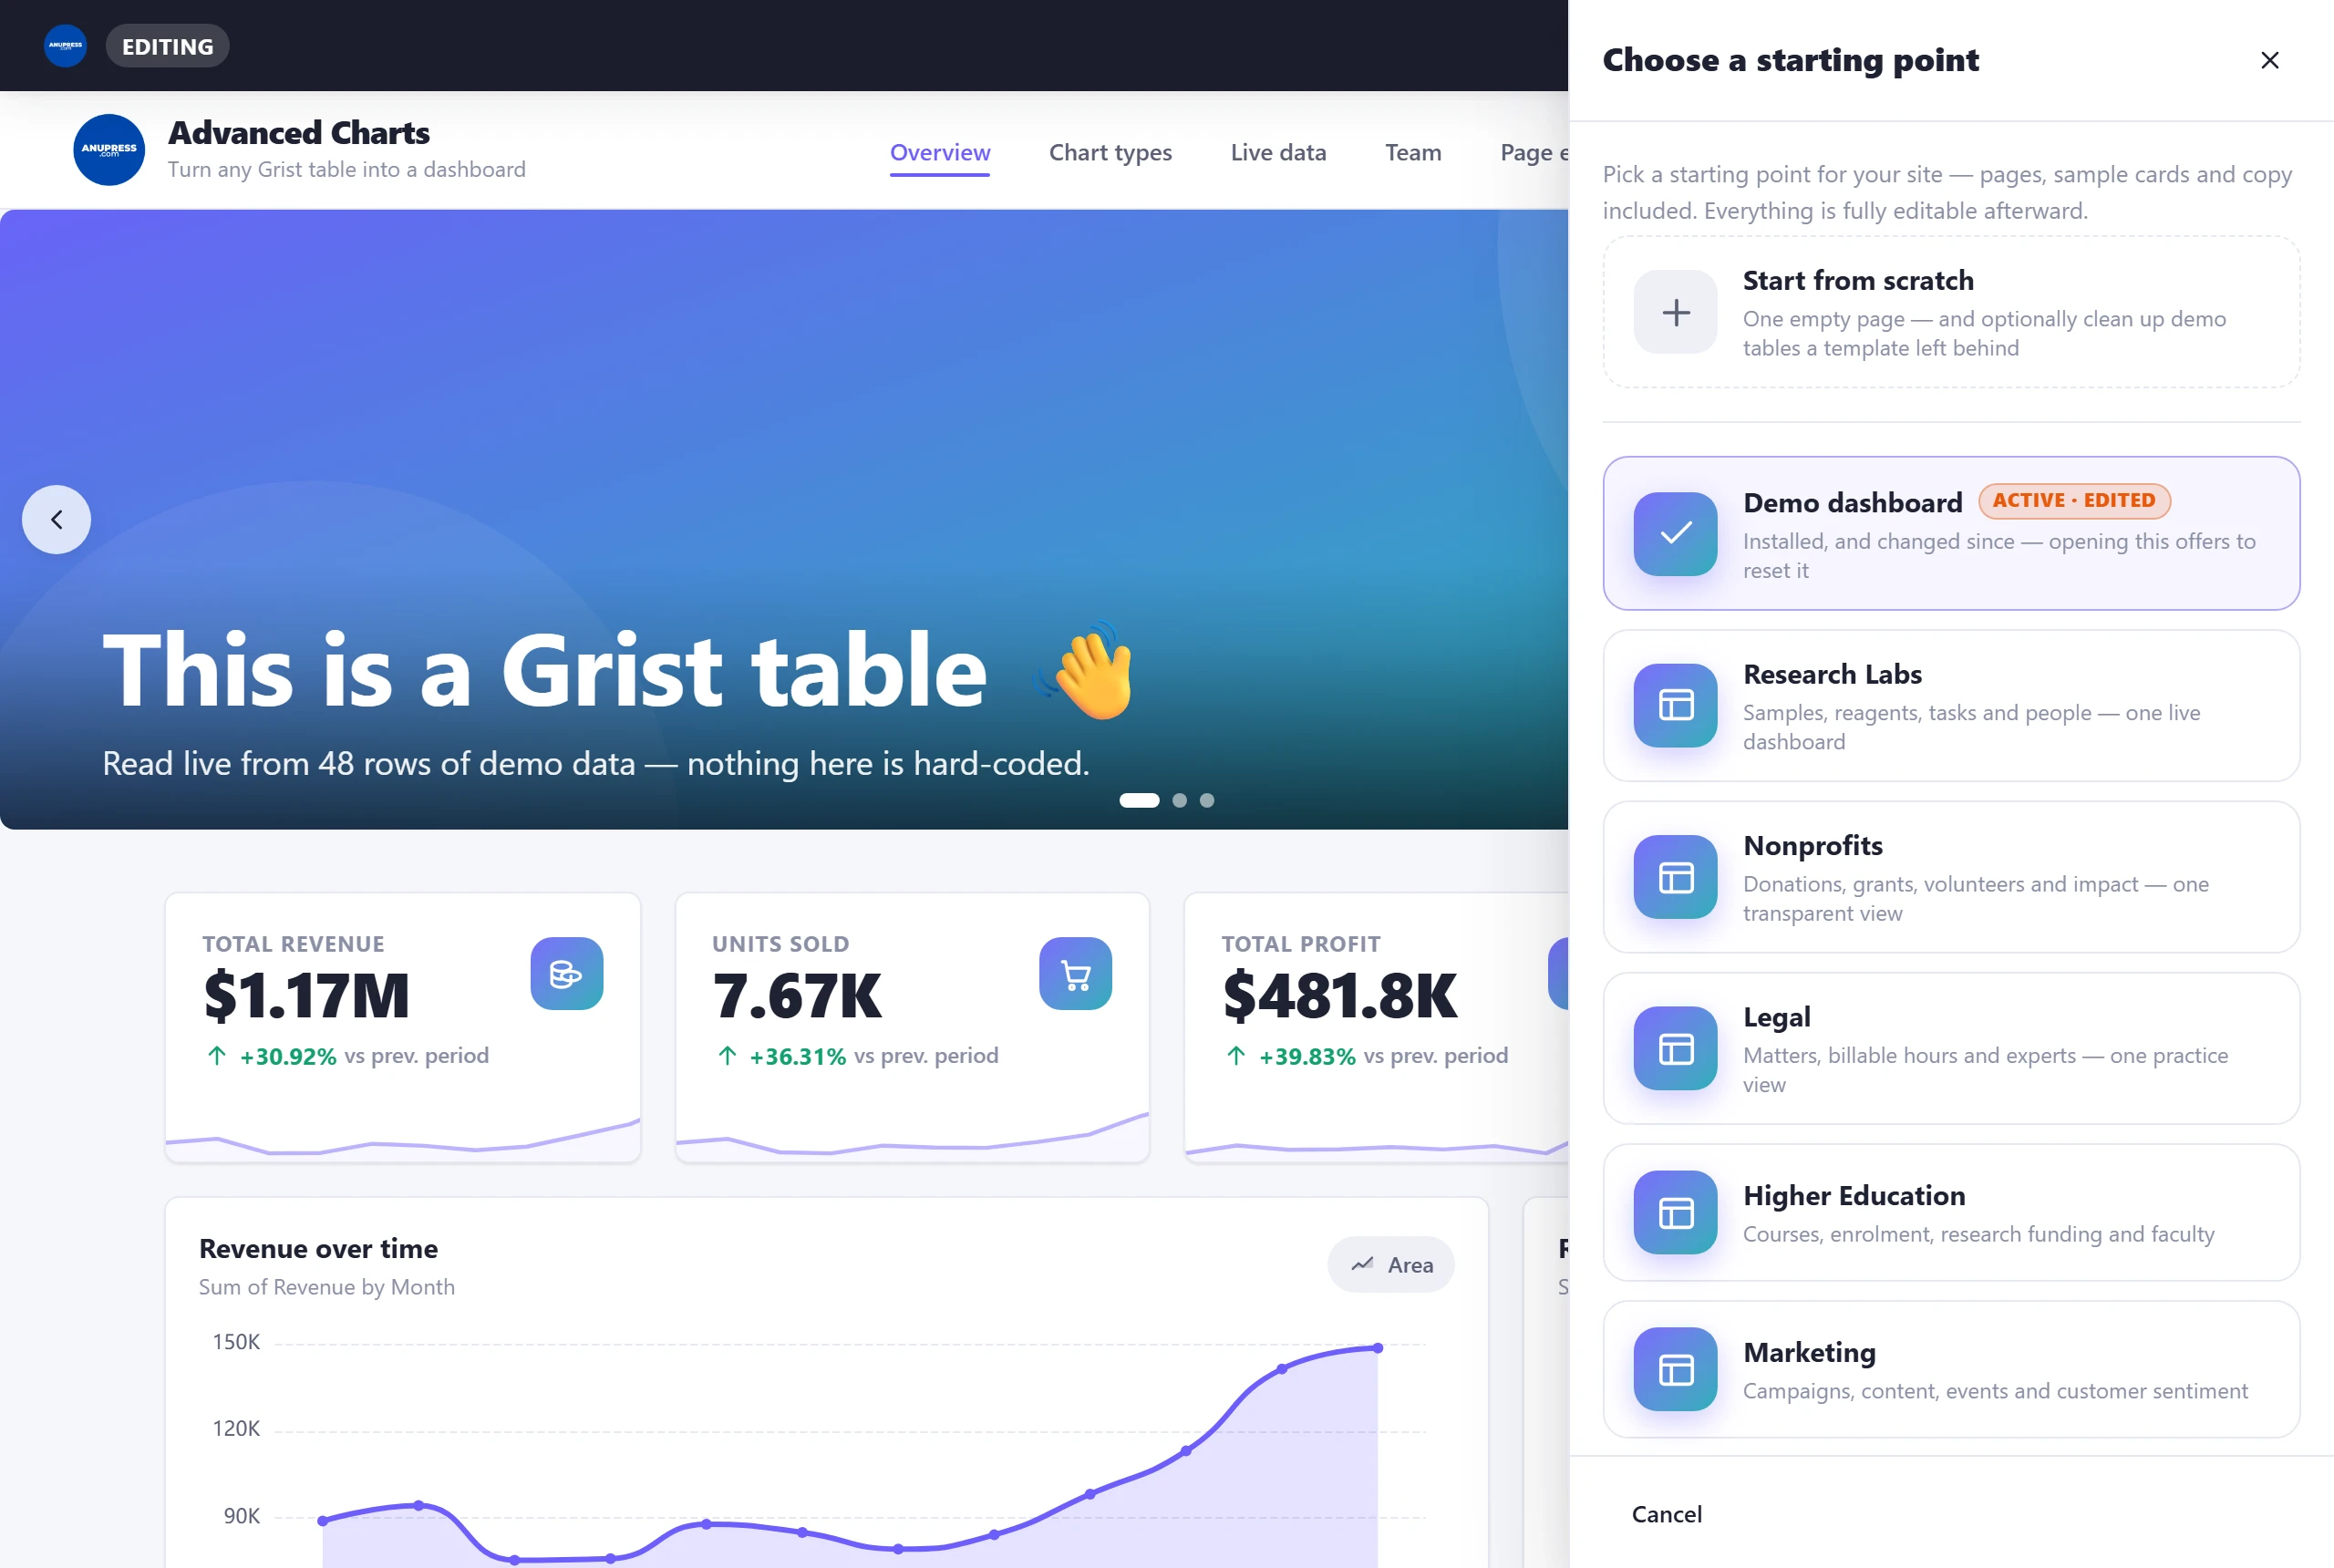
The table setup is the part worth knowing about. For each table a template uses, you choose:
- Create it with sample data (the default) — the widget writes the table into your document, filled with plausible rows, and remembers that it created it.
- Point it at one of your own tables — a column‑matching step asks which of your columns plays each role. Your table is only read. Nothing in it is changed.
A concrete example of the mapping: say you install Finance & Accounting but already keep invoices in
a table called Sales2026. During install, set the template’s Invoices table to
“Use my Sales2026” (hovering an entry in that list shows the table on the left, so you can tell
Sales2026 from Sales2025 by its rows), and the column matcher asks which of your columns holds the invoice number, the
client, the amount, the status and the dates. It guesses by name first (an InvoiceNo column
is matched automatically) and anything it can’t guess you pick from a dropdown, or skip. Skipped columns
just leave that detail off the blocks — nothing breaks.
Two things worth knowing if your own tables are linked to each other. Since v3.1 a reference column shows the name it points at: map the Legal template onto a Matters table whose Client column references a Clients table, and the dashboard reads “Meridian Biotech”, not “2”, in every table, chart and breakdown. And since v3.2 you can drop a Slicer block onto any template page: a slicer on Clients narrows every block whose table points at Clients, so a “which client?” control comes for free on top of the templates below.
After Apply, the design saves to your document immediately. Everything is then ordinary editing: rename pages, delete blocks, repoint charts, change the palette. The main guide covers all of that.
All 10 Grist dashboard templates at a glance
Here are the Grist dashboard templates side by side; each name jumps to its tour below.
| Template | Built for | Pages |
|---|---|---|
| Research Labs | Sample tracking, turnaround SLAs, reagents and lab staff | 5 |
| Nonprofits | Donations, grants and volunteers without exposing donor names | 5 |
| Legal | Matters, billable hours, invoices and an expert witness directory | 5 |
| Higher Education | Course enrolment vs capacity, research funding, faculty | 5 |
| Marketing | Campaign ROI, content, social, events and NPS | 6 |
| Finance & Accounting | Money in vs money out: invoices, payroll, expenses | 5 |
| Developers | A status page plus issues, releases and incidents (dark by default) | 5 |
| Small Business | Pipeline, customers, team and costs on one owner’s screen | 5 |
| Sports Facility | Bookings, utilisation, membership tiers and league standings | 5 |
| Demo dashboard | The widget’s guided tour, reinstallable as a sandbox | 6 |
1. Research Labs
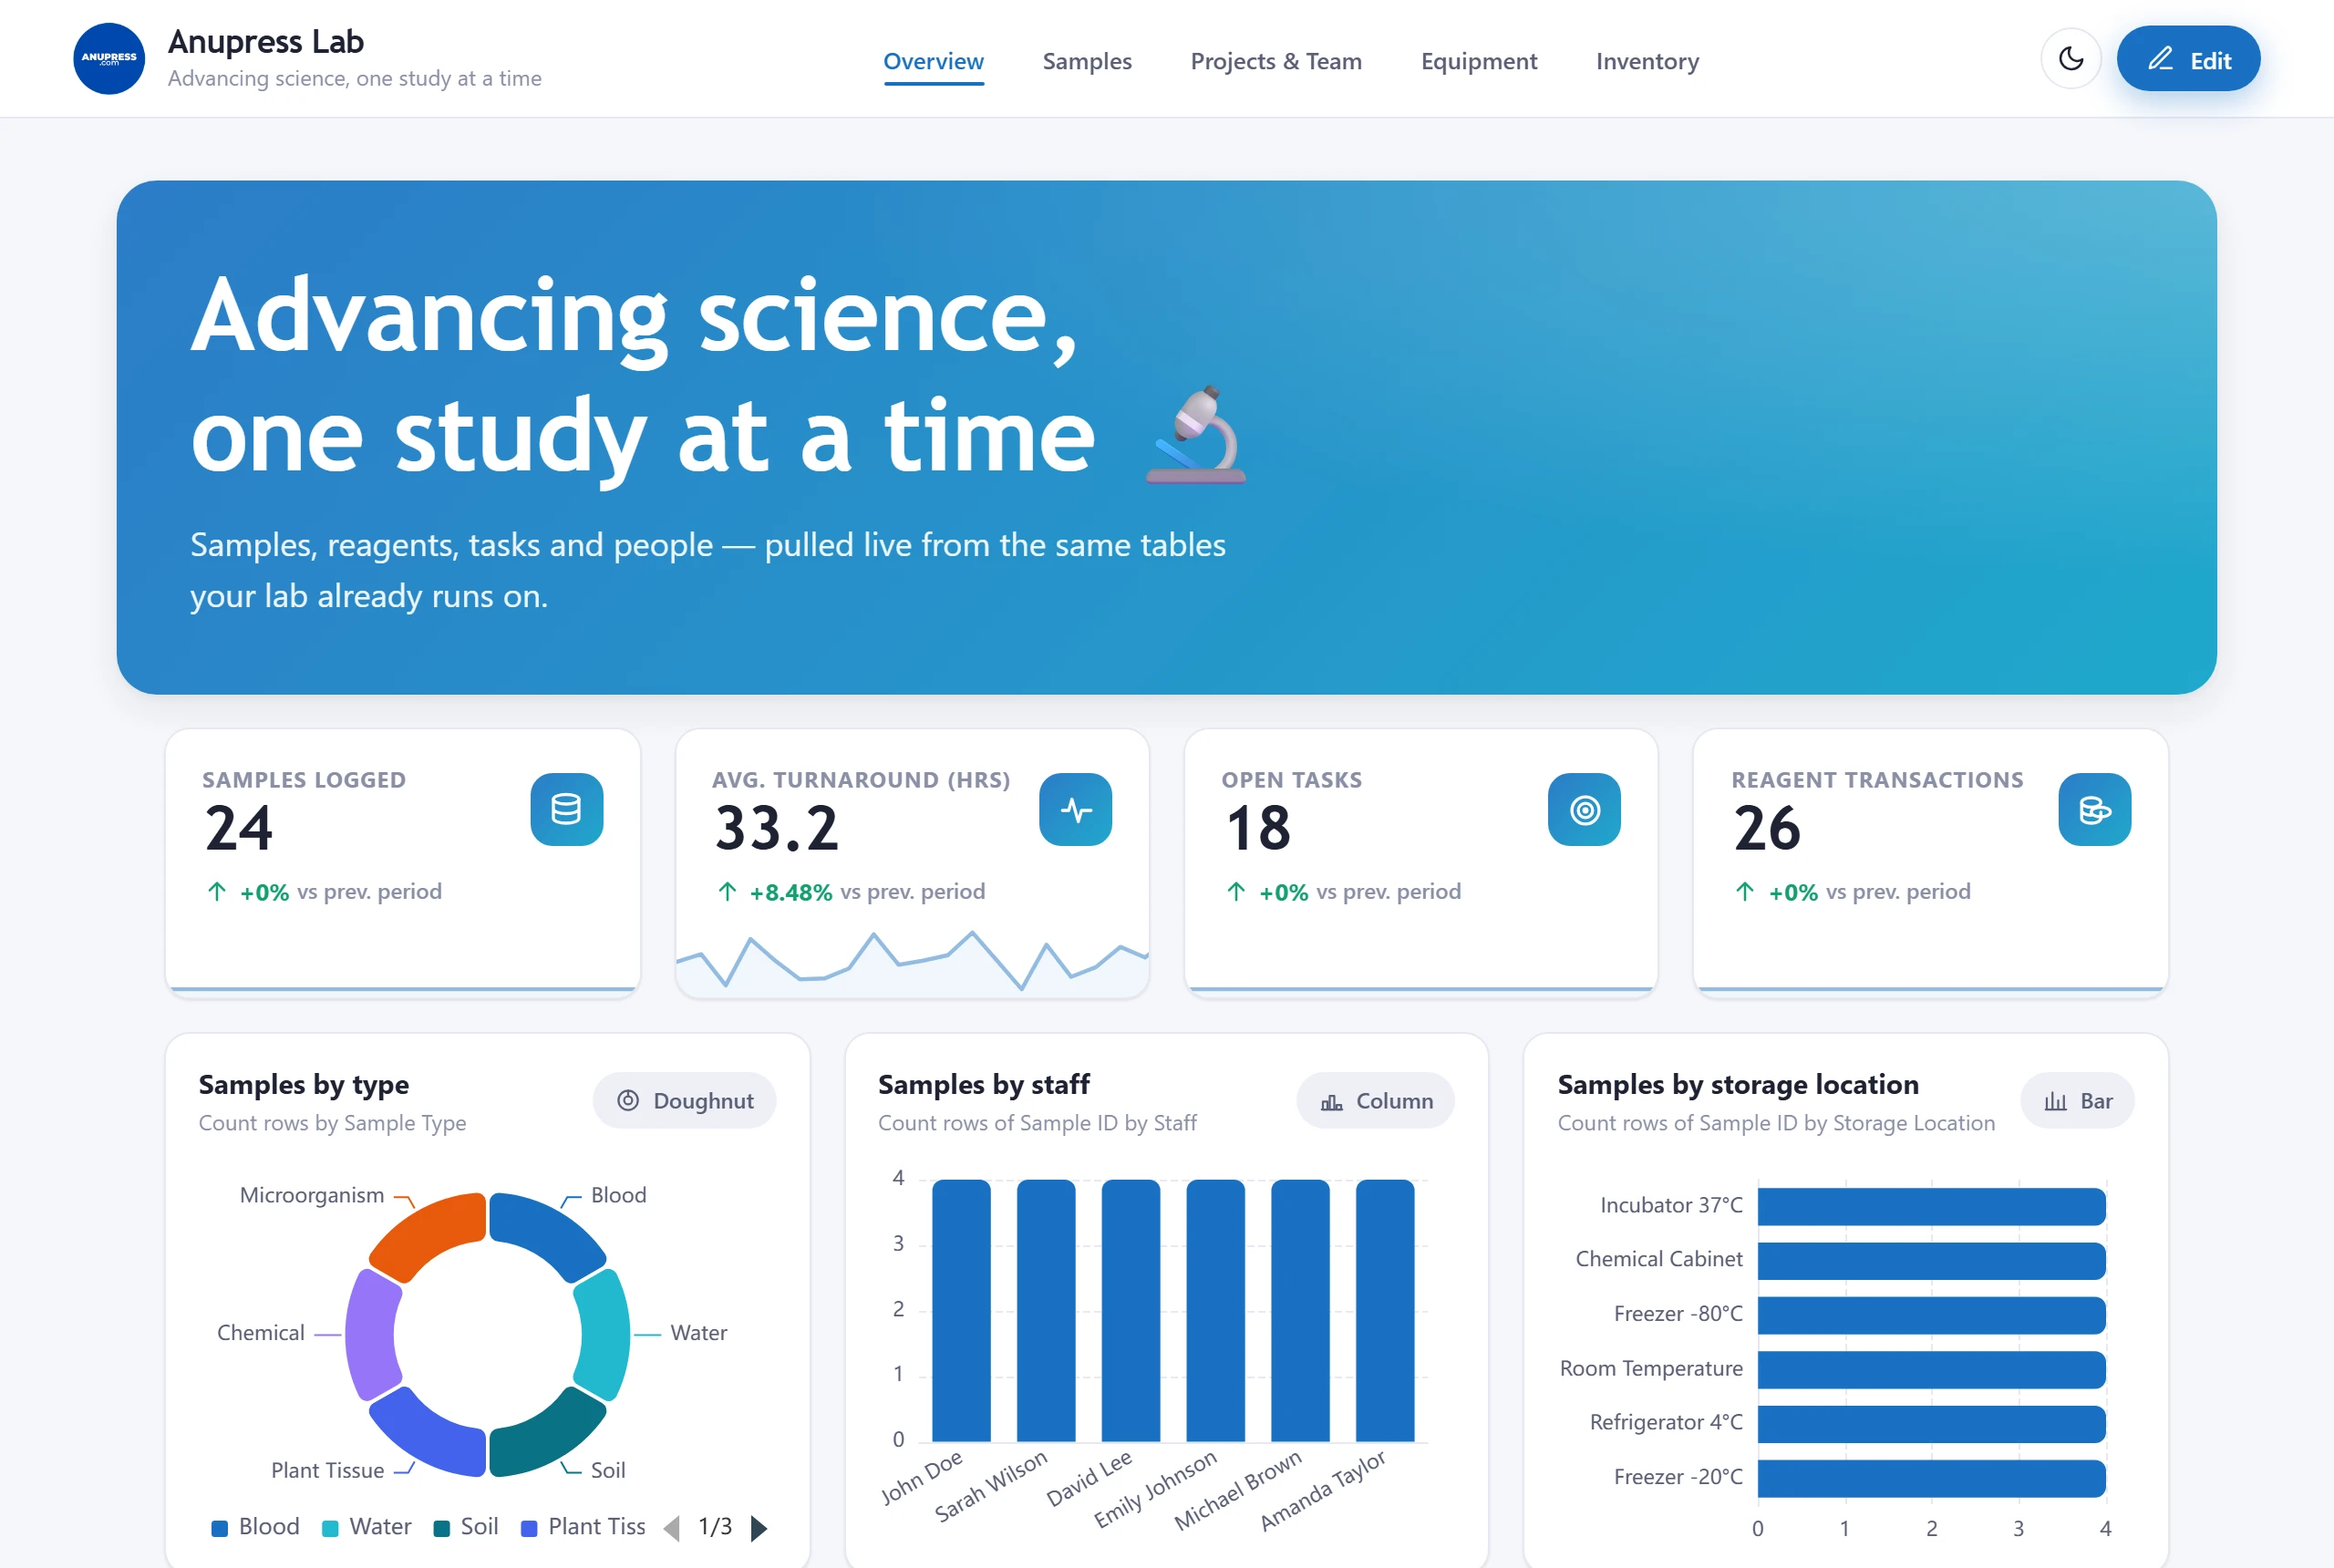
Built for a working lab’s four kinds of record: what came in, what it was tested with, who is doing what, and where things are stored. The overview leads with the numbers a lab manager checks daily — samples logged, average turnaround against a 48‑hour SLA shown as a progress bar, open tasks, reagent transactions — and a countdown to the next grant deadline sits right on the front page.
This is also the template with the most realistic table structure: five separate tables rather than one flat sheet, so the dashboard demonstrates blocks reading different tables side by side. Sample locations plot on a map from latitude/longitude columns, and the samples table doubles as a storage lookup.
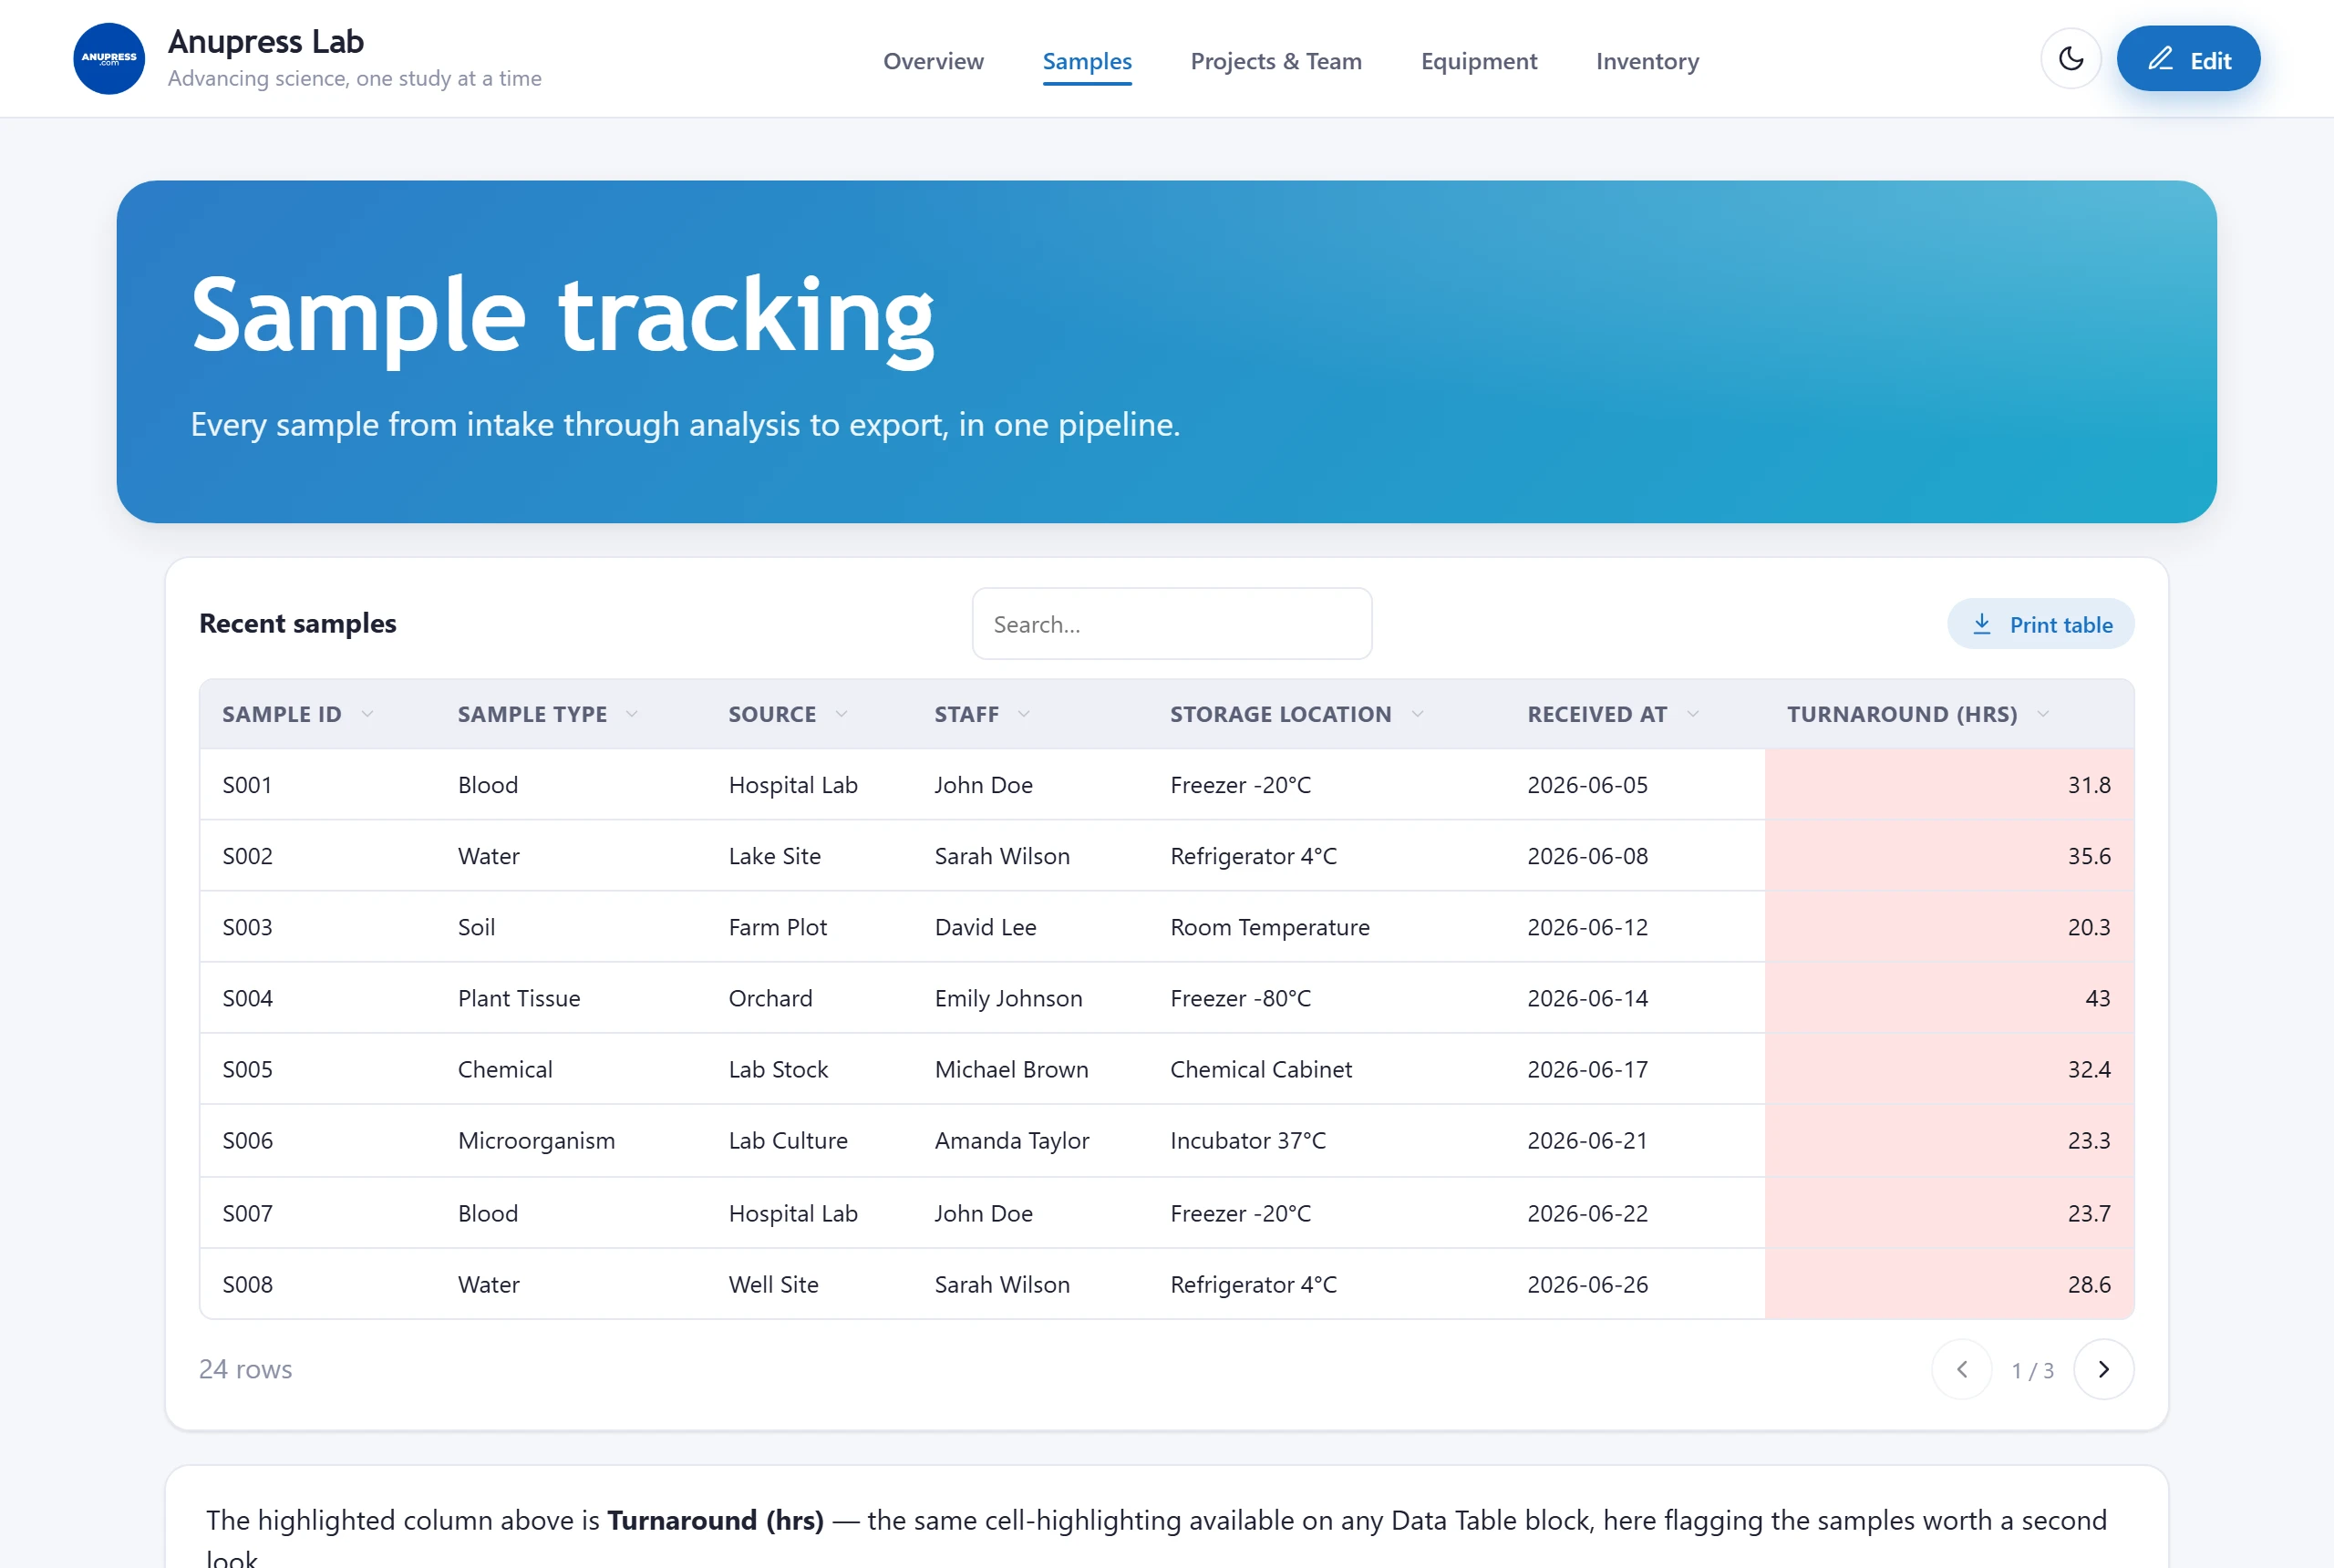
Sample tables: Samples, Reagents, Tasks, People, Instruments
2. Nonprofits
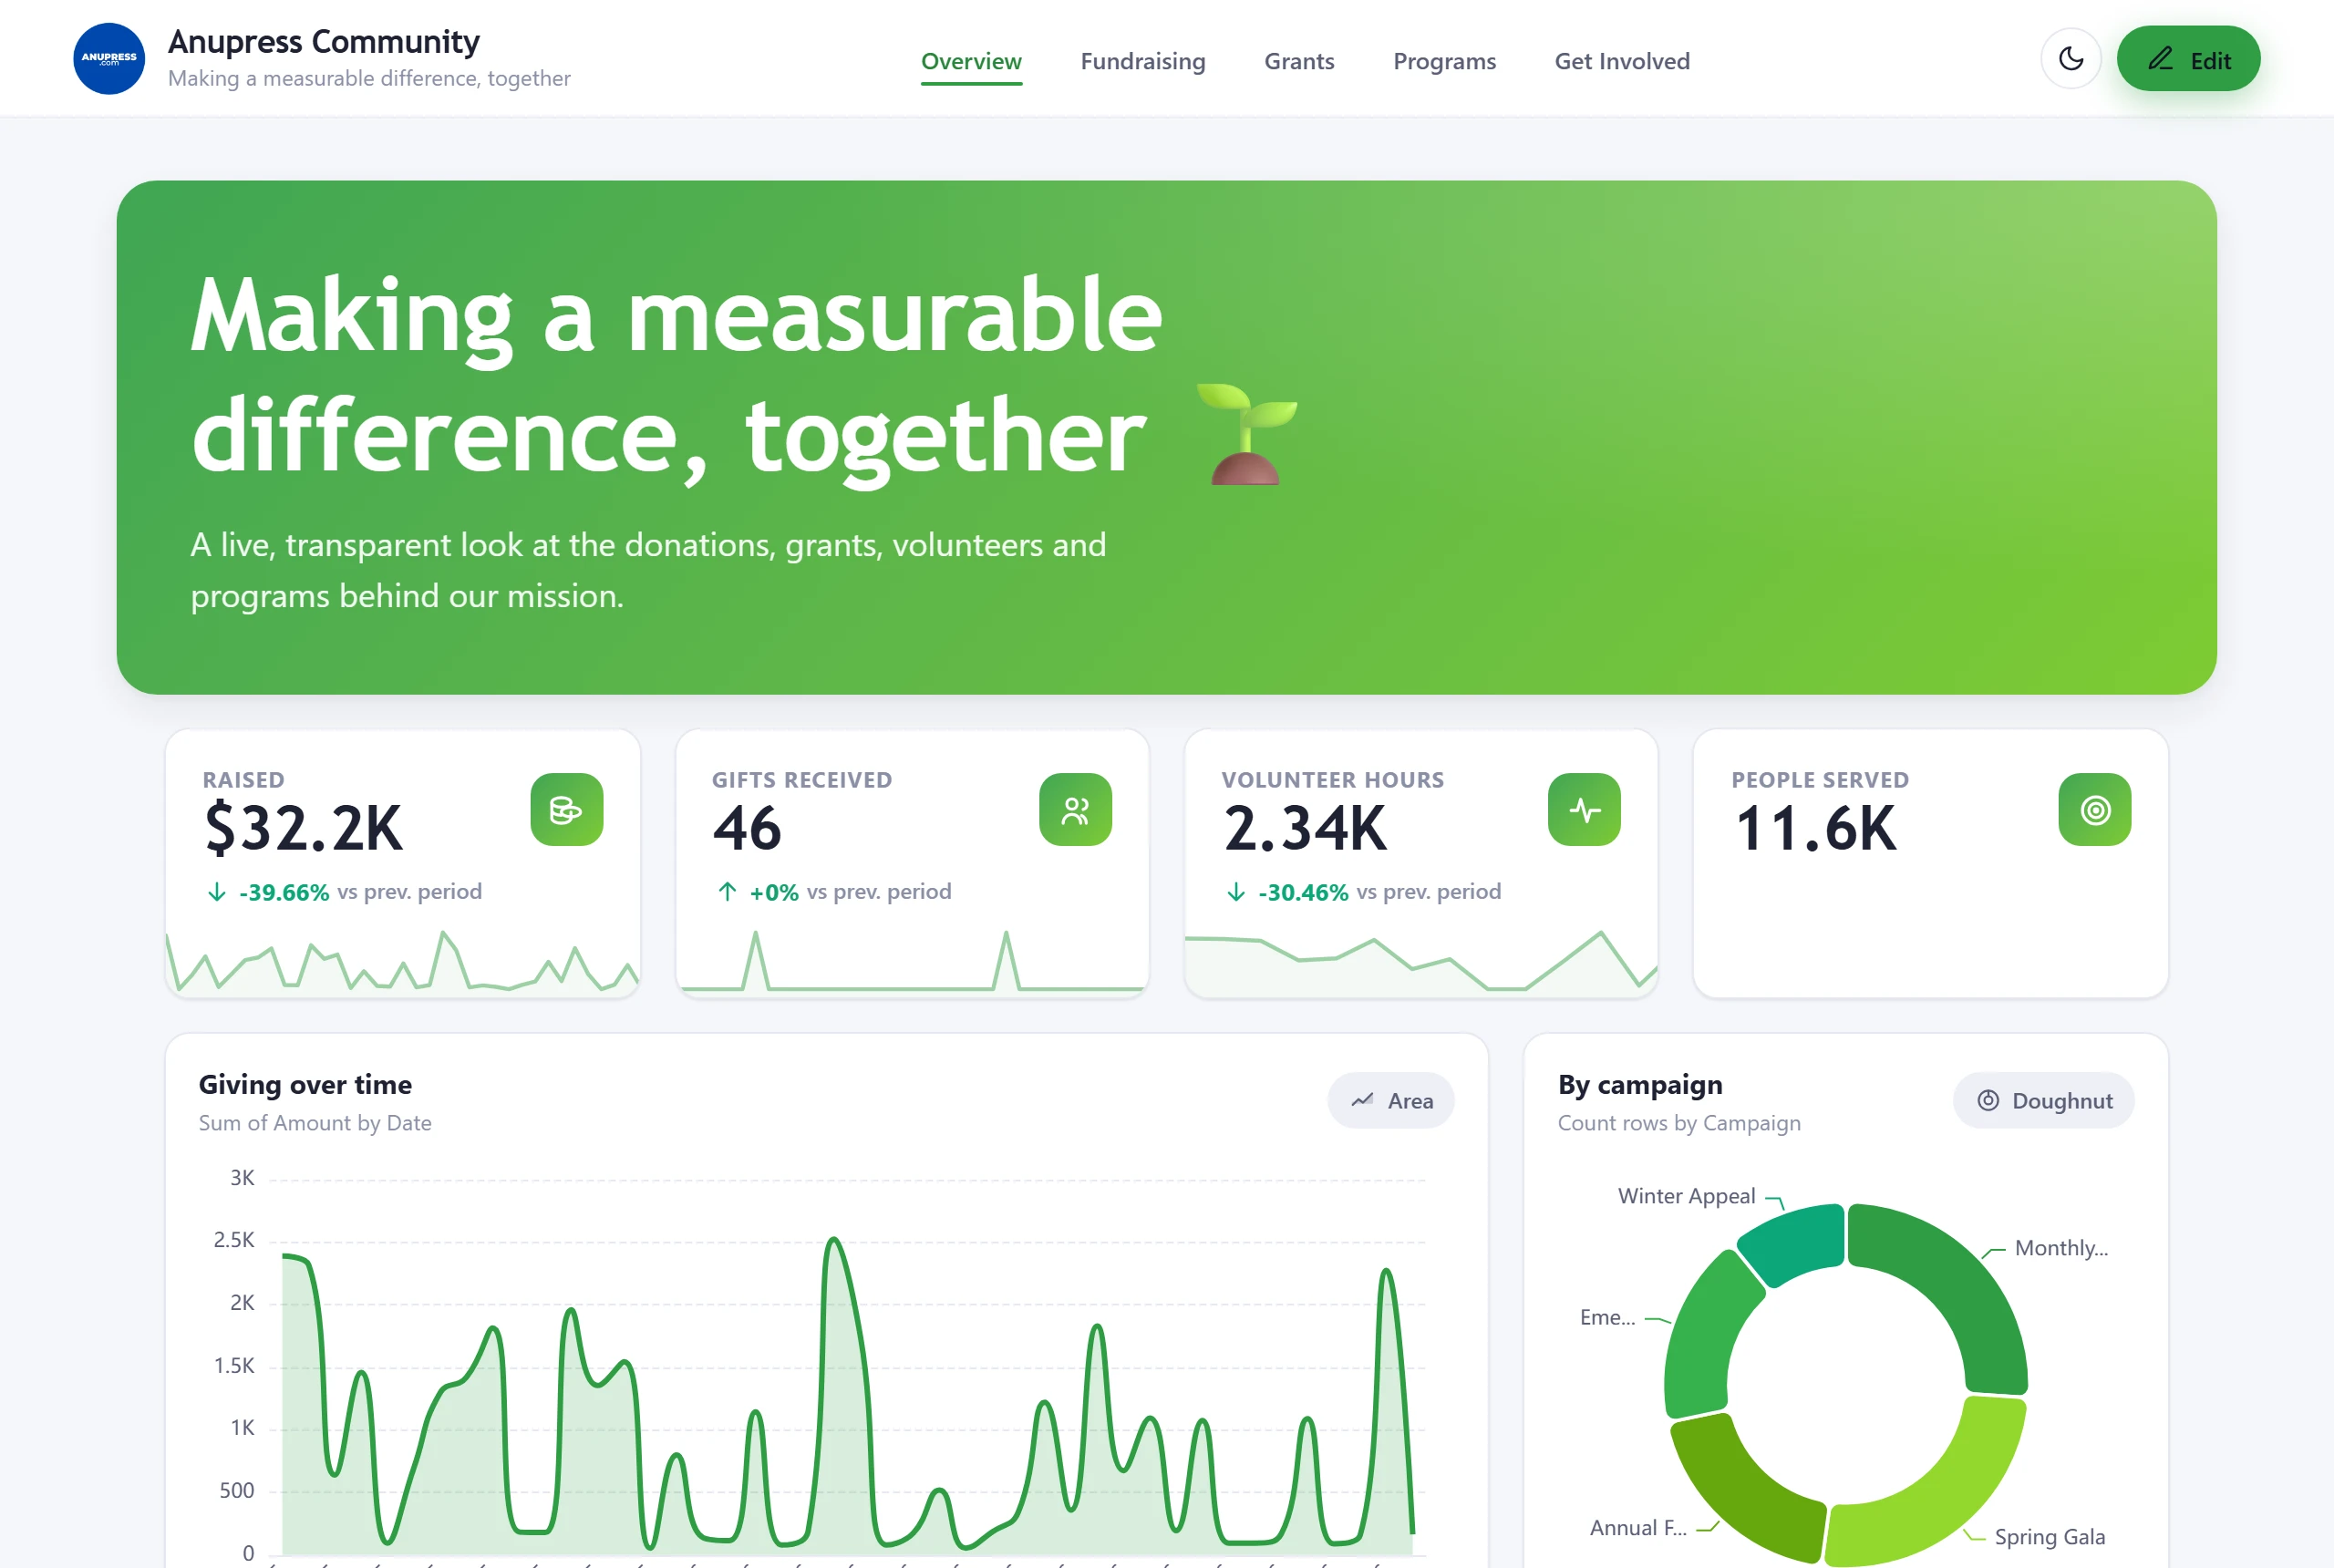
Most nonprofits already keep donations, grants and volunteer lists in spreadsheets; this template turns them into the transparent view boards and donors keep asking for. Fundraising progress is a goal bar, grants have their own page with status and deadlines, and programs get impact numbers rather than just spend.
One deliberate design choice: the dashboard shows donation totals, trends and splits — never a table of who gave what. Donor names don’t belong on a published page, and the template’s blocks are picked so they never appear on one. A “Get Involved” page with buttons and a signup call‑to‑action rounds it out, because the audience for a nonprofit dashboard is usually being asked to join something.
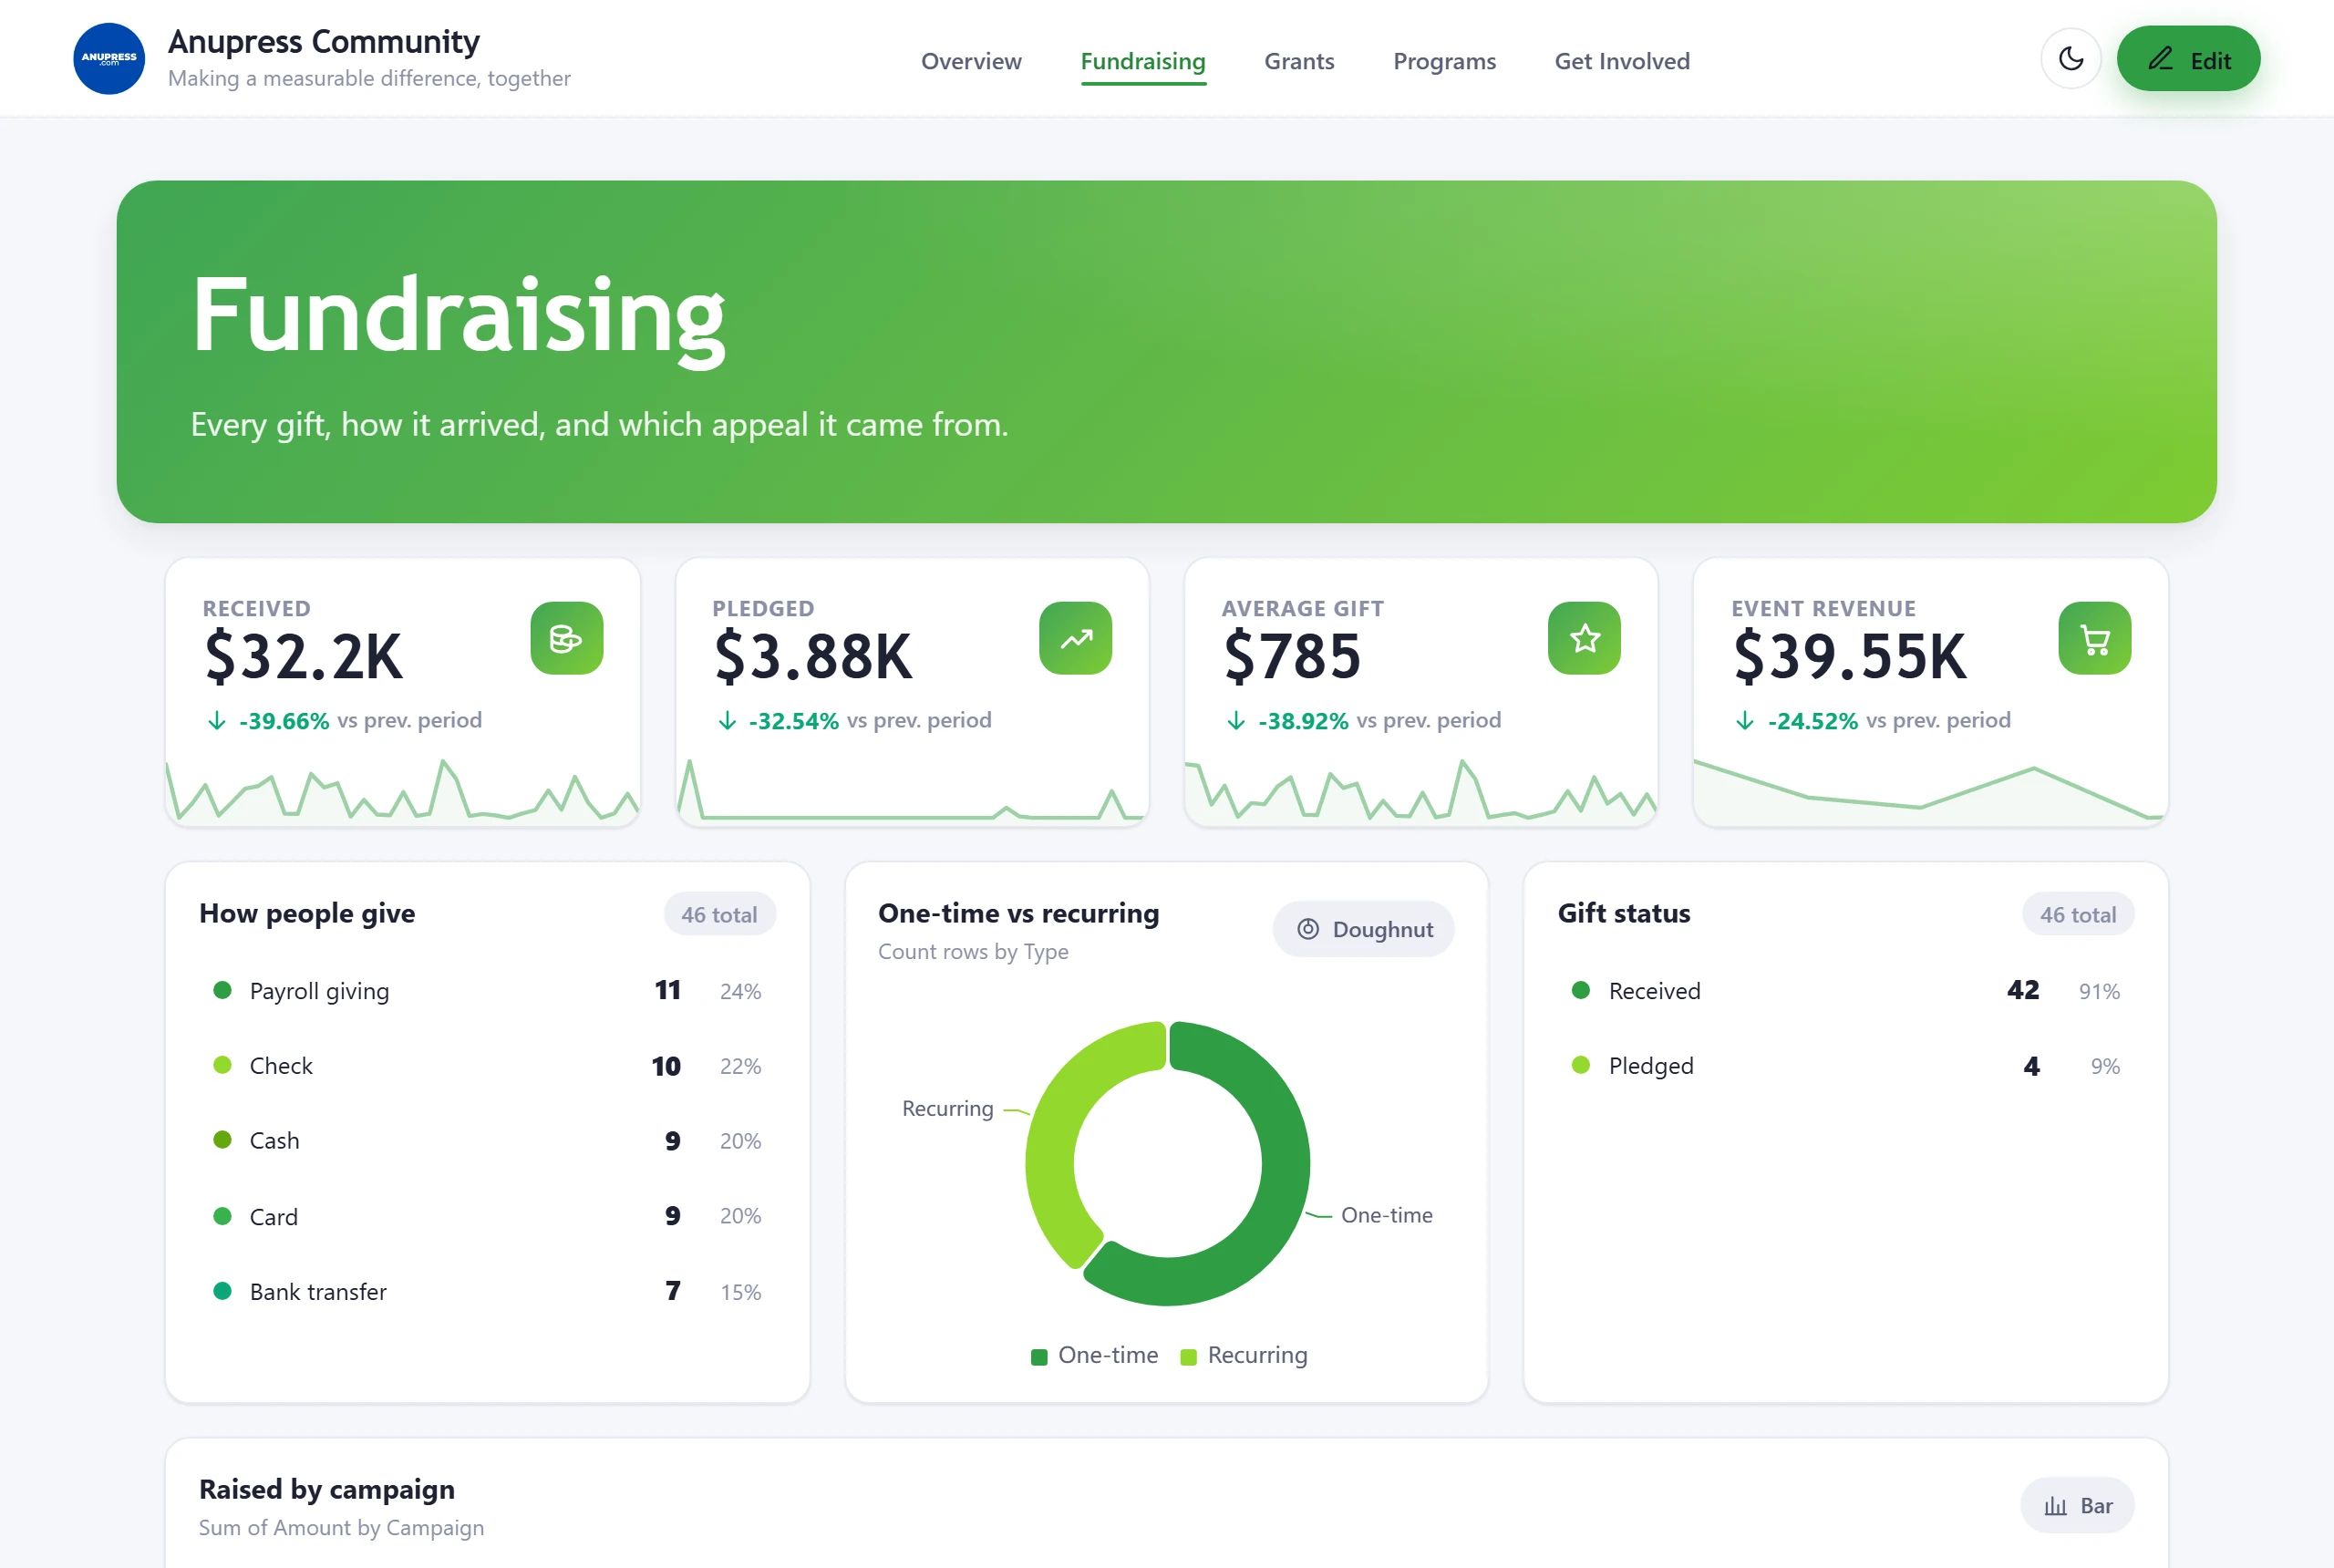
Sample tables: Donations, Grants, Volunteers, Programs, Events
3. Legal
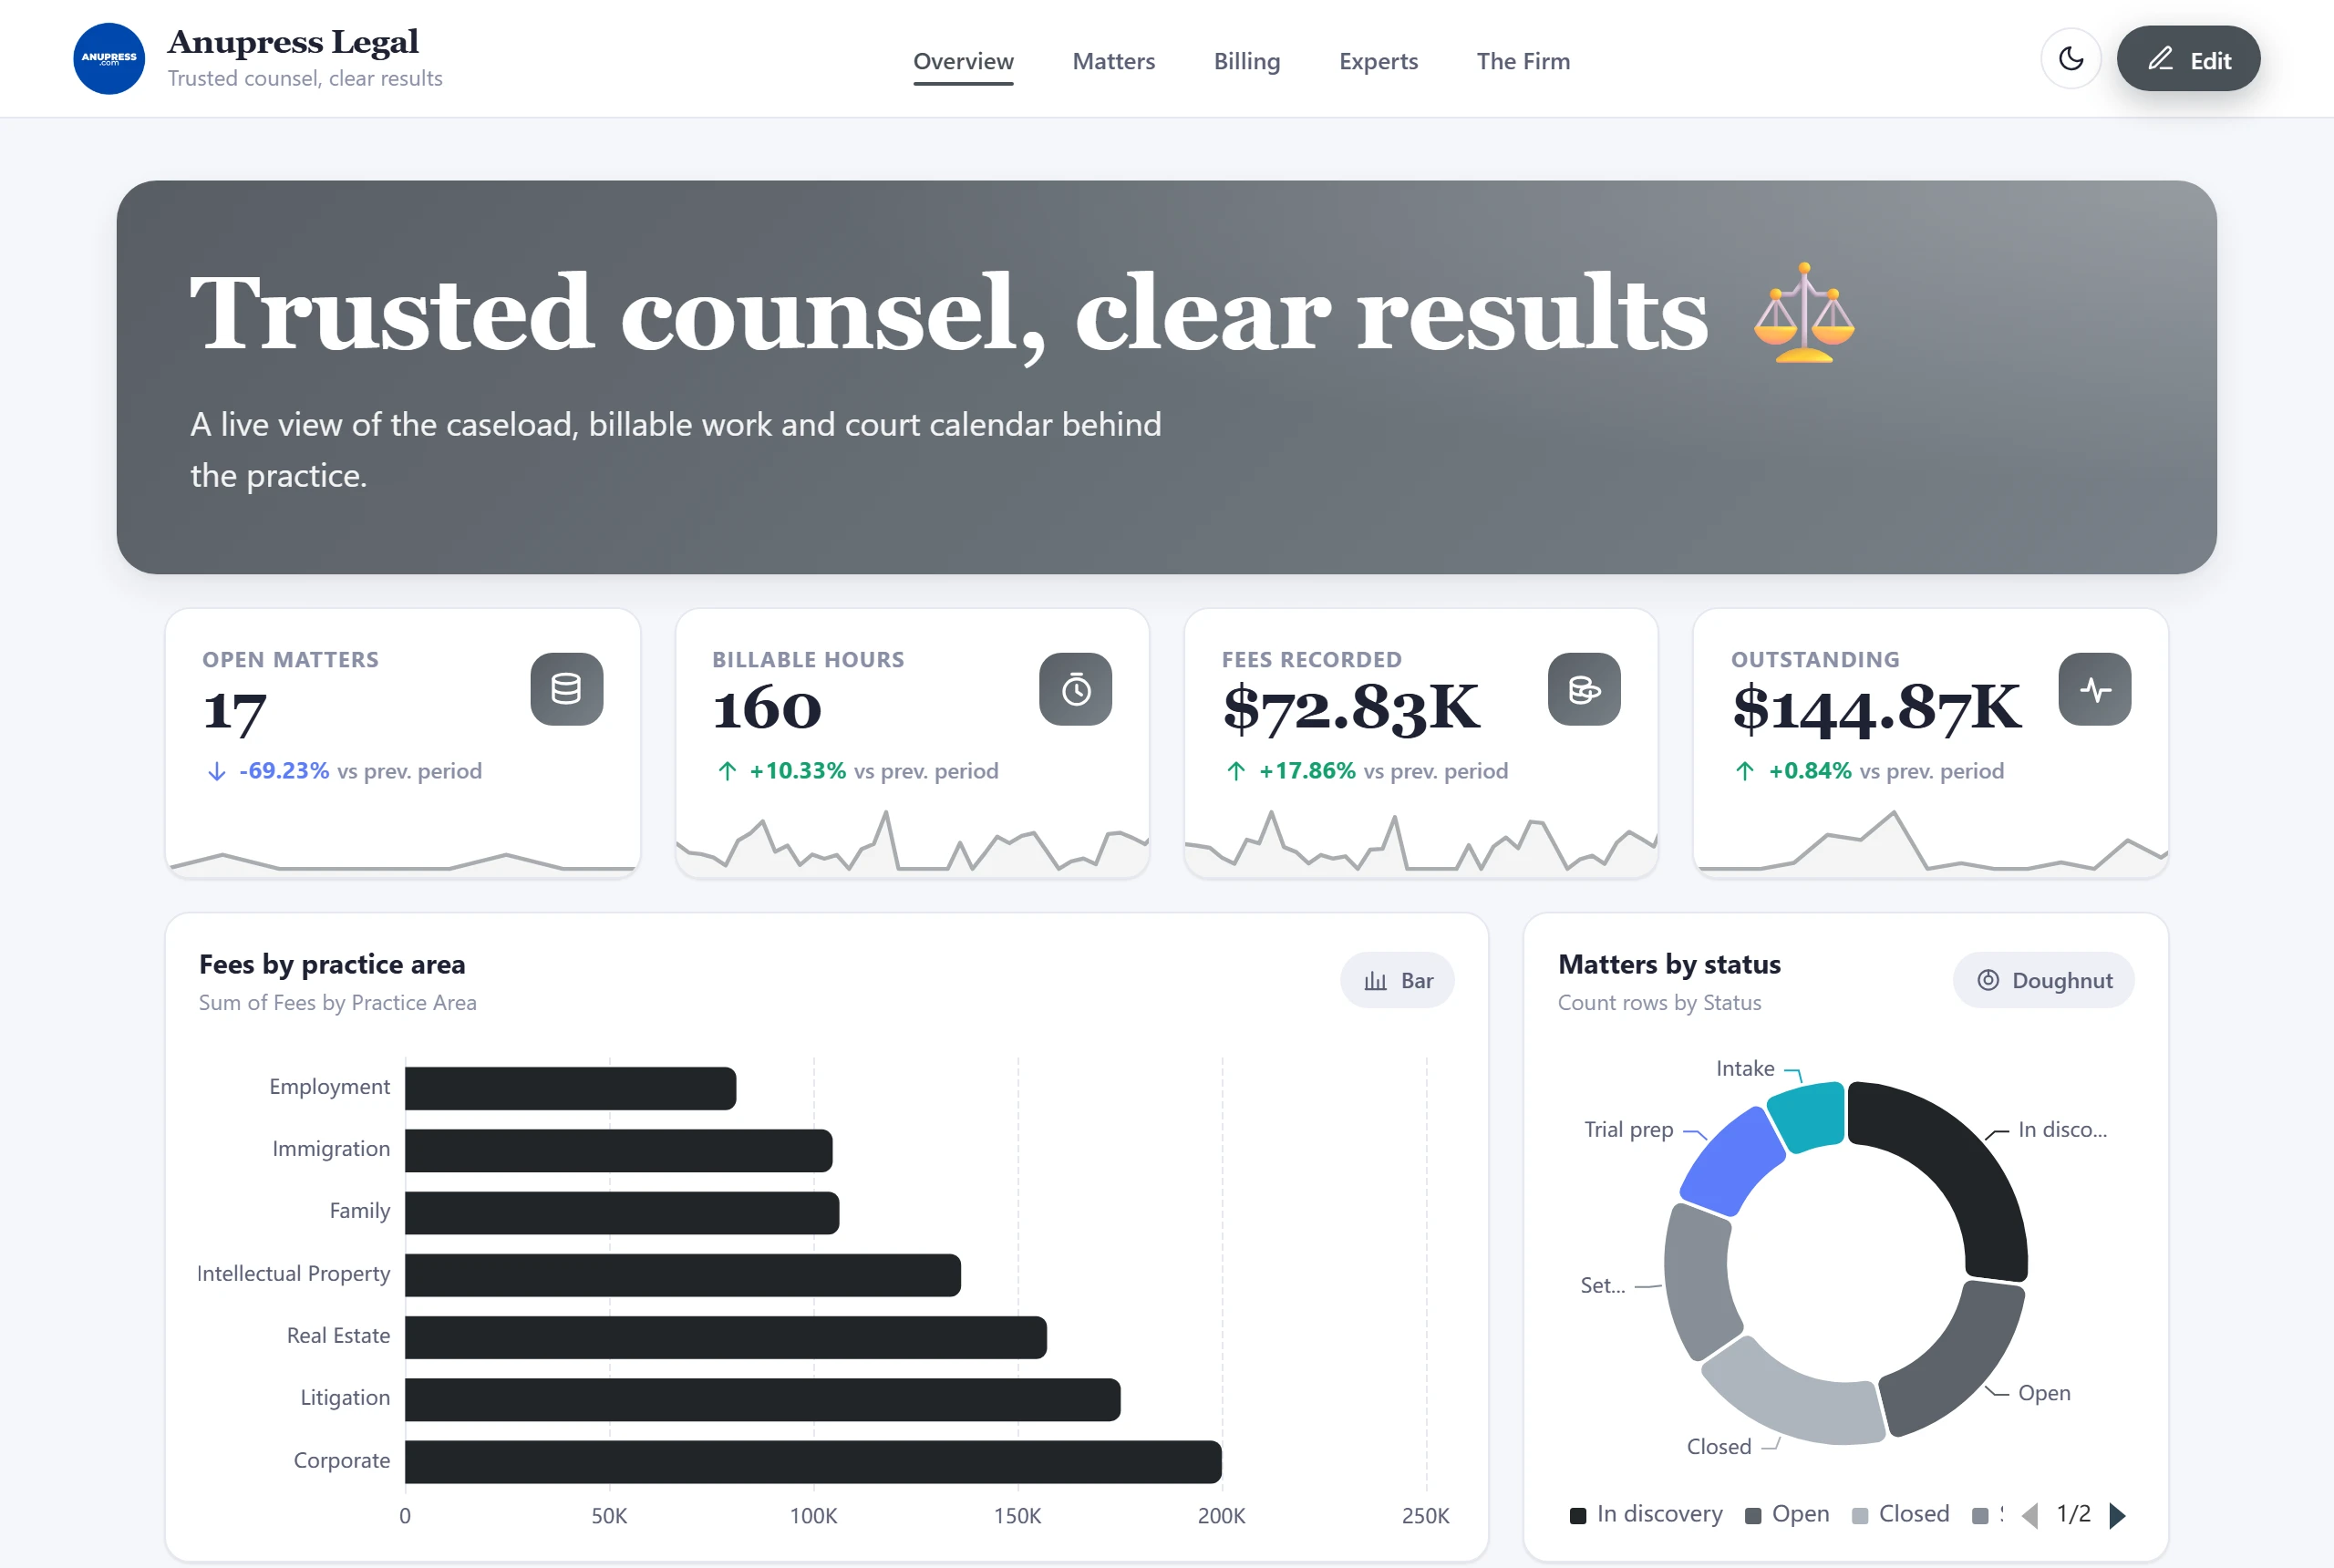
Everything in a practice hangs off the matter, and the template is built the same way: matters carry status and practice area, time entries and invoices point back at them, and the billing page turns hours into money — billed, collected, outstanding. Because Advanced Charts has a real invoice block, an unpaid invoice here is one click from being a printable document.
The expert witness directory is the piece you won’t find in generic CRM templates: specialty, engagement history and rates in one searchable table, which is exactly the thing firms keep losing in someone’s inbox. A “The Firm” page presents the practice itself, pricing models included.
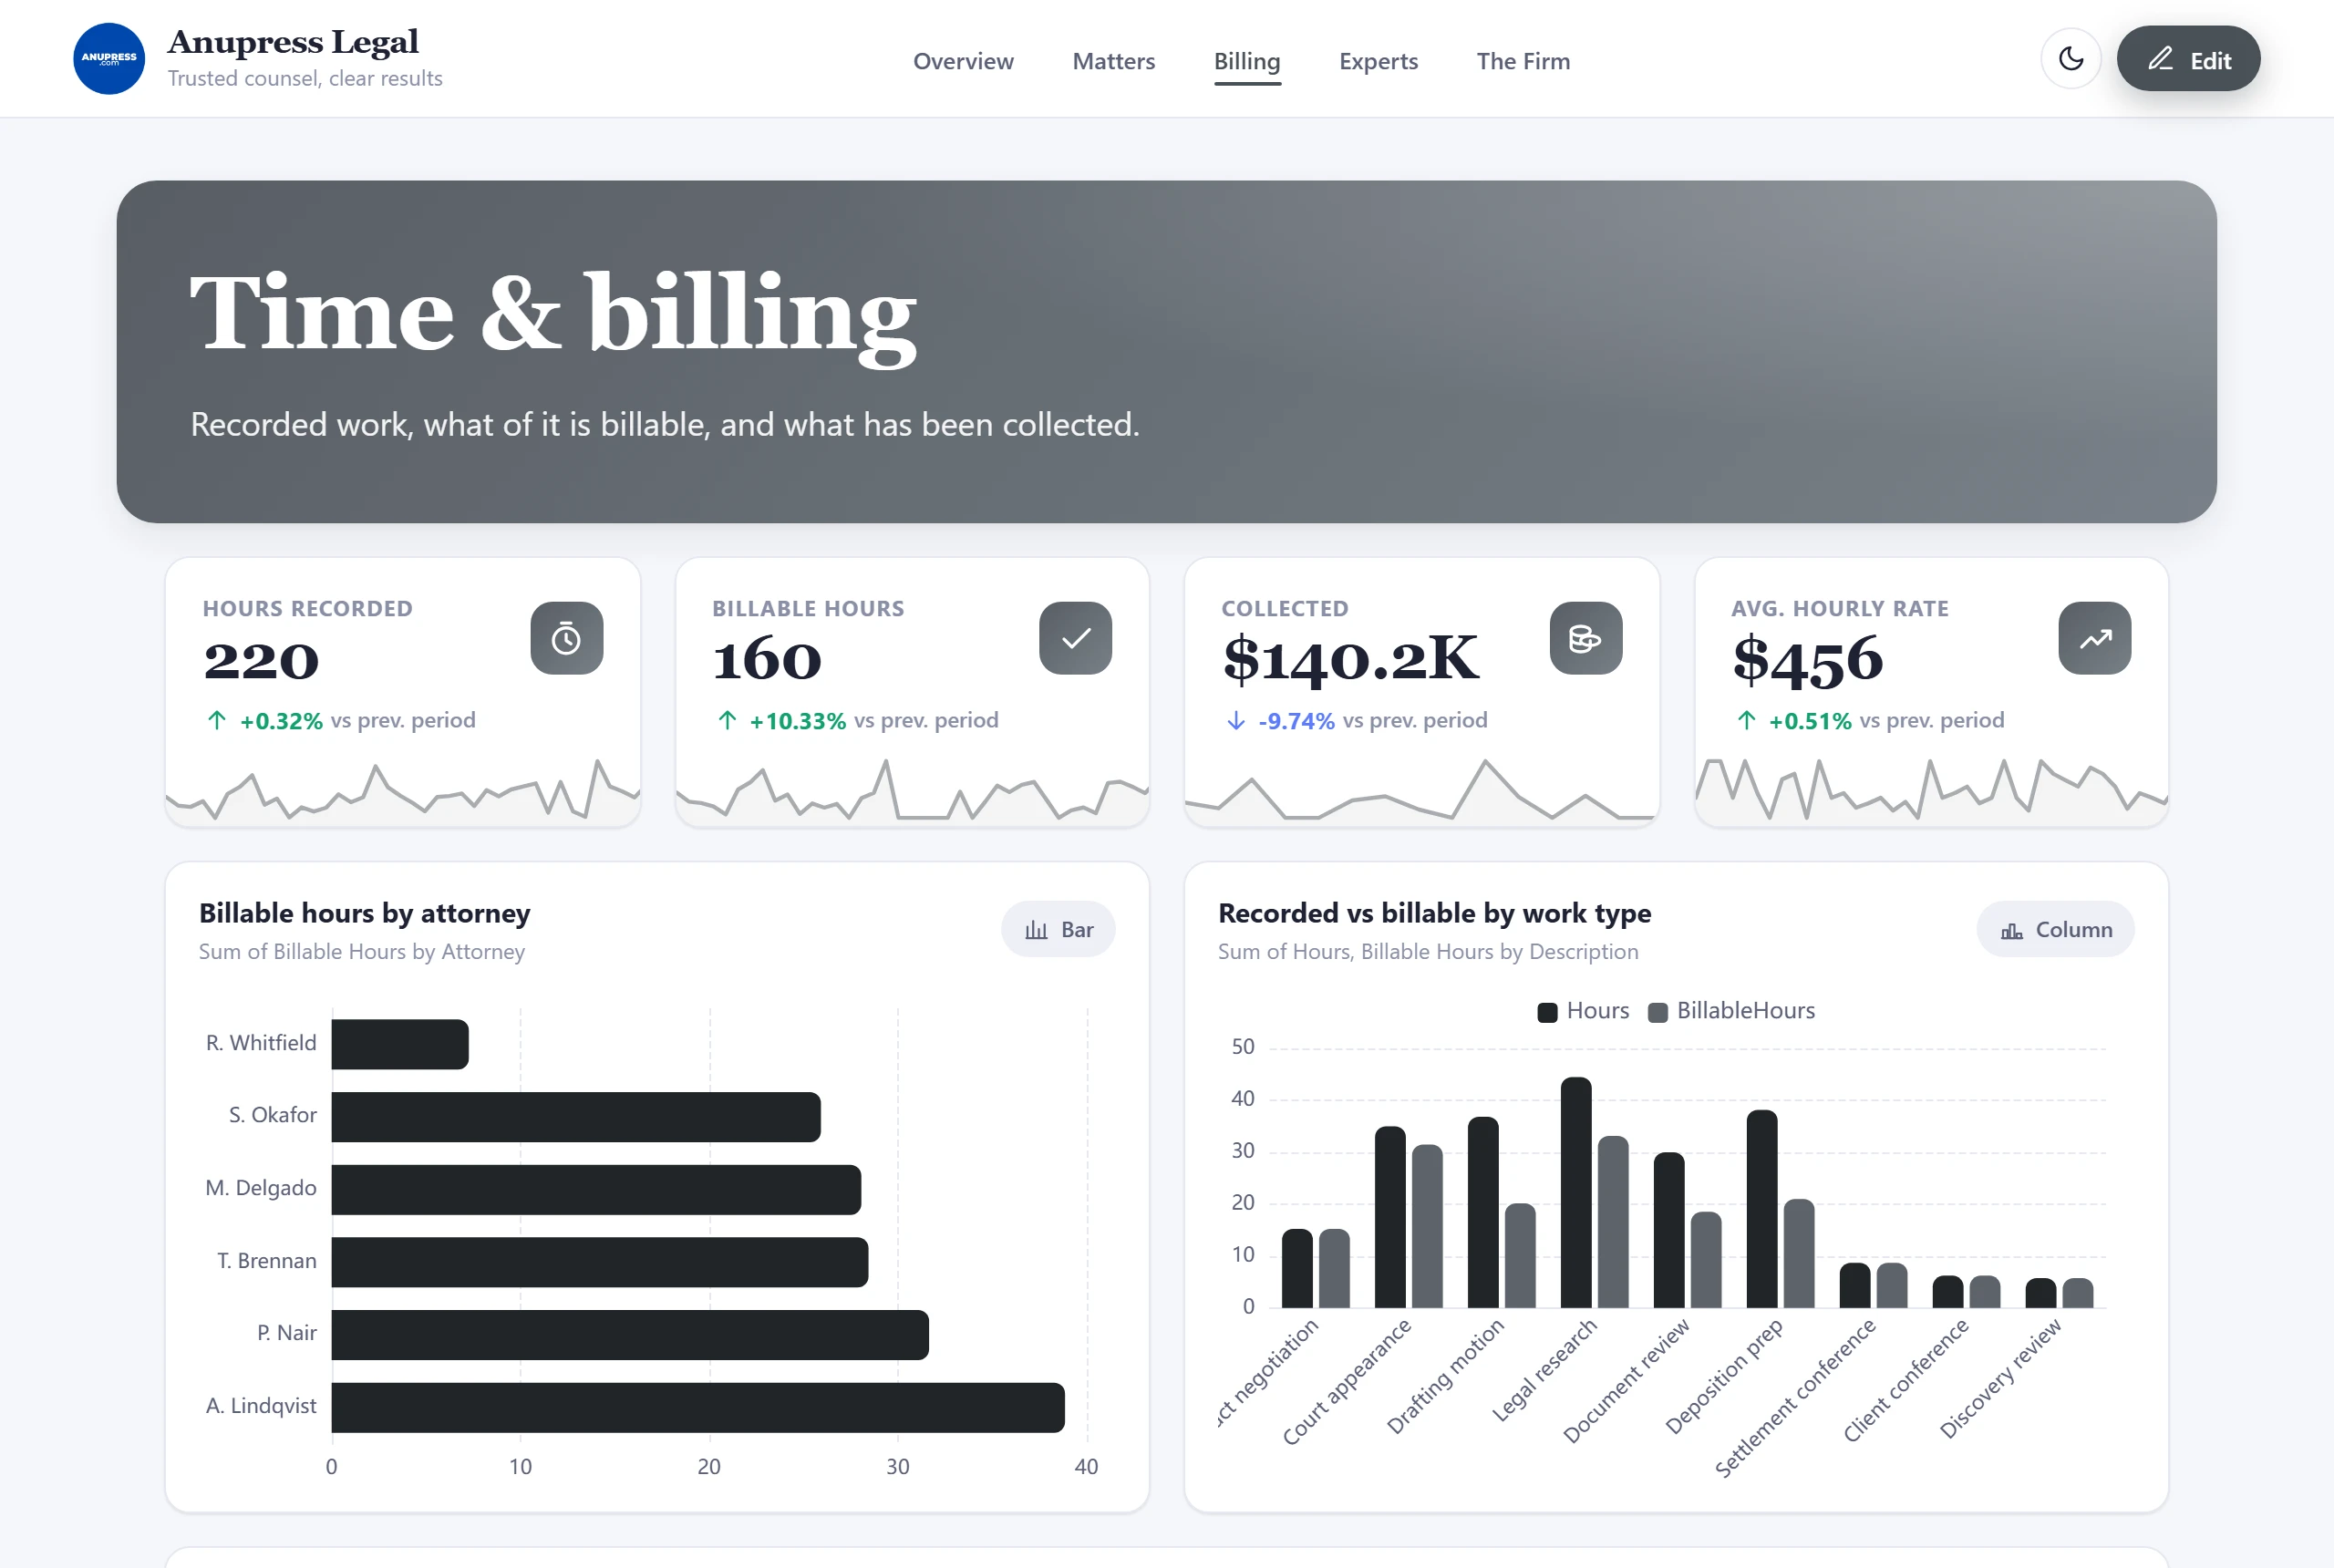
Sample tables: Matters, TimeEntries, Invoices, Clients, ExpertWitnesses
4. Higher Education
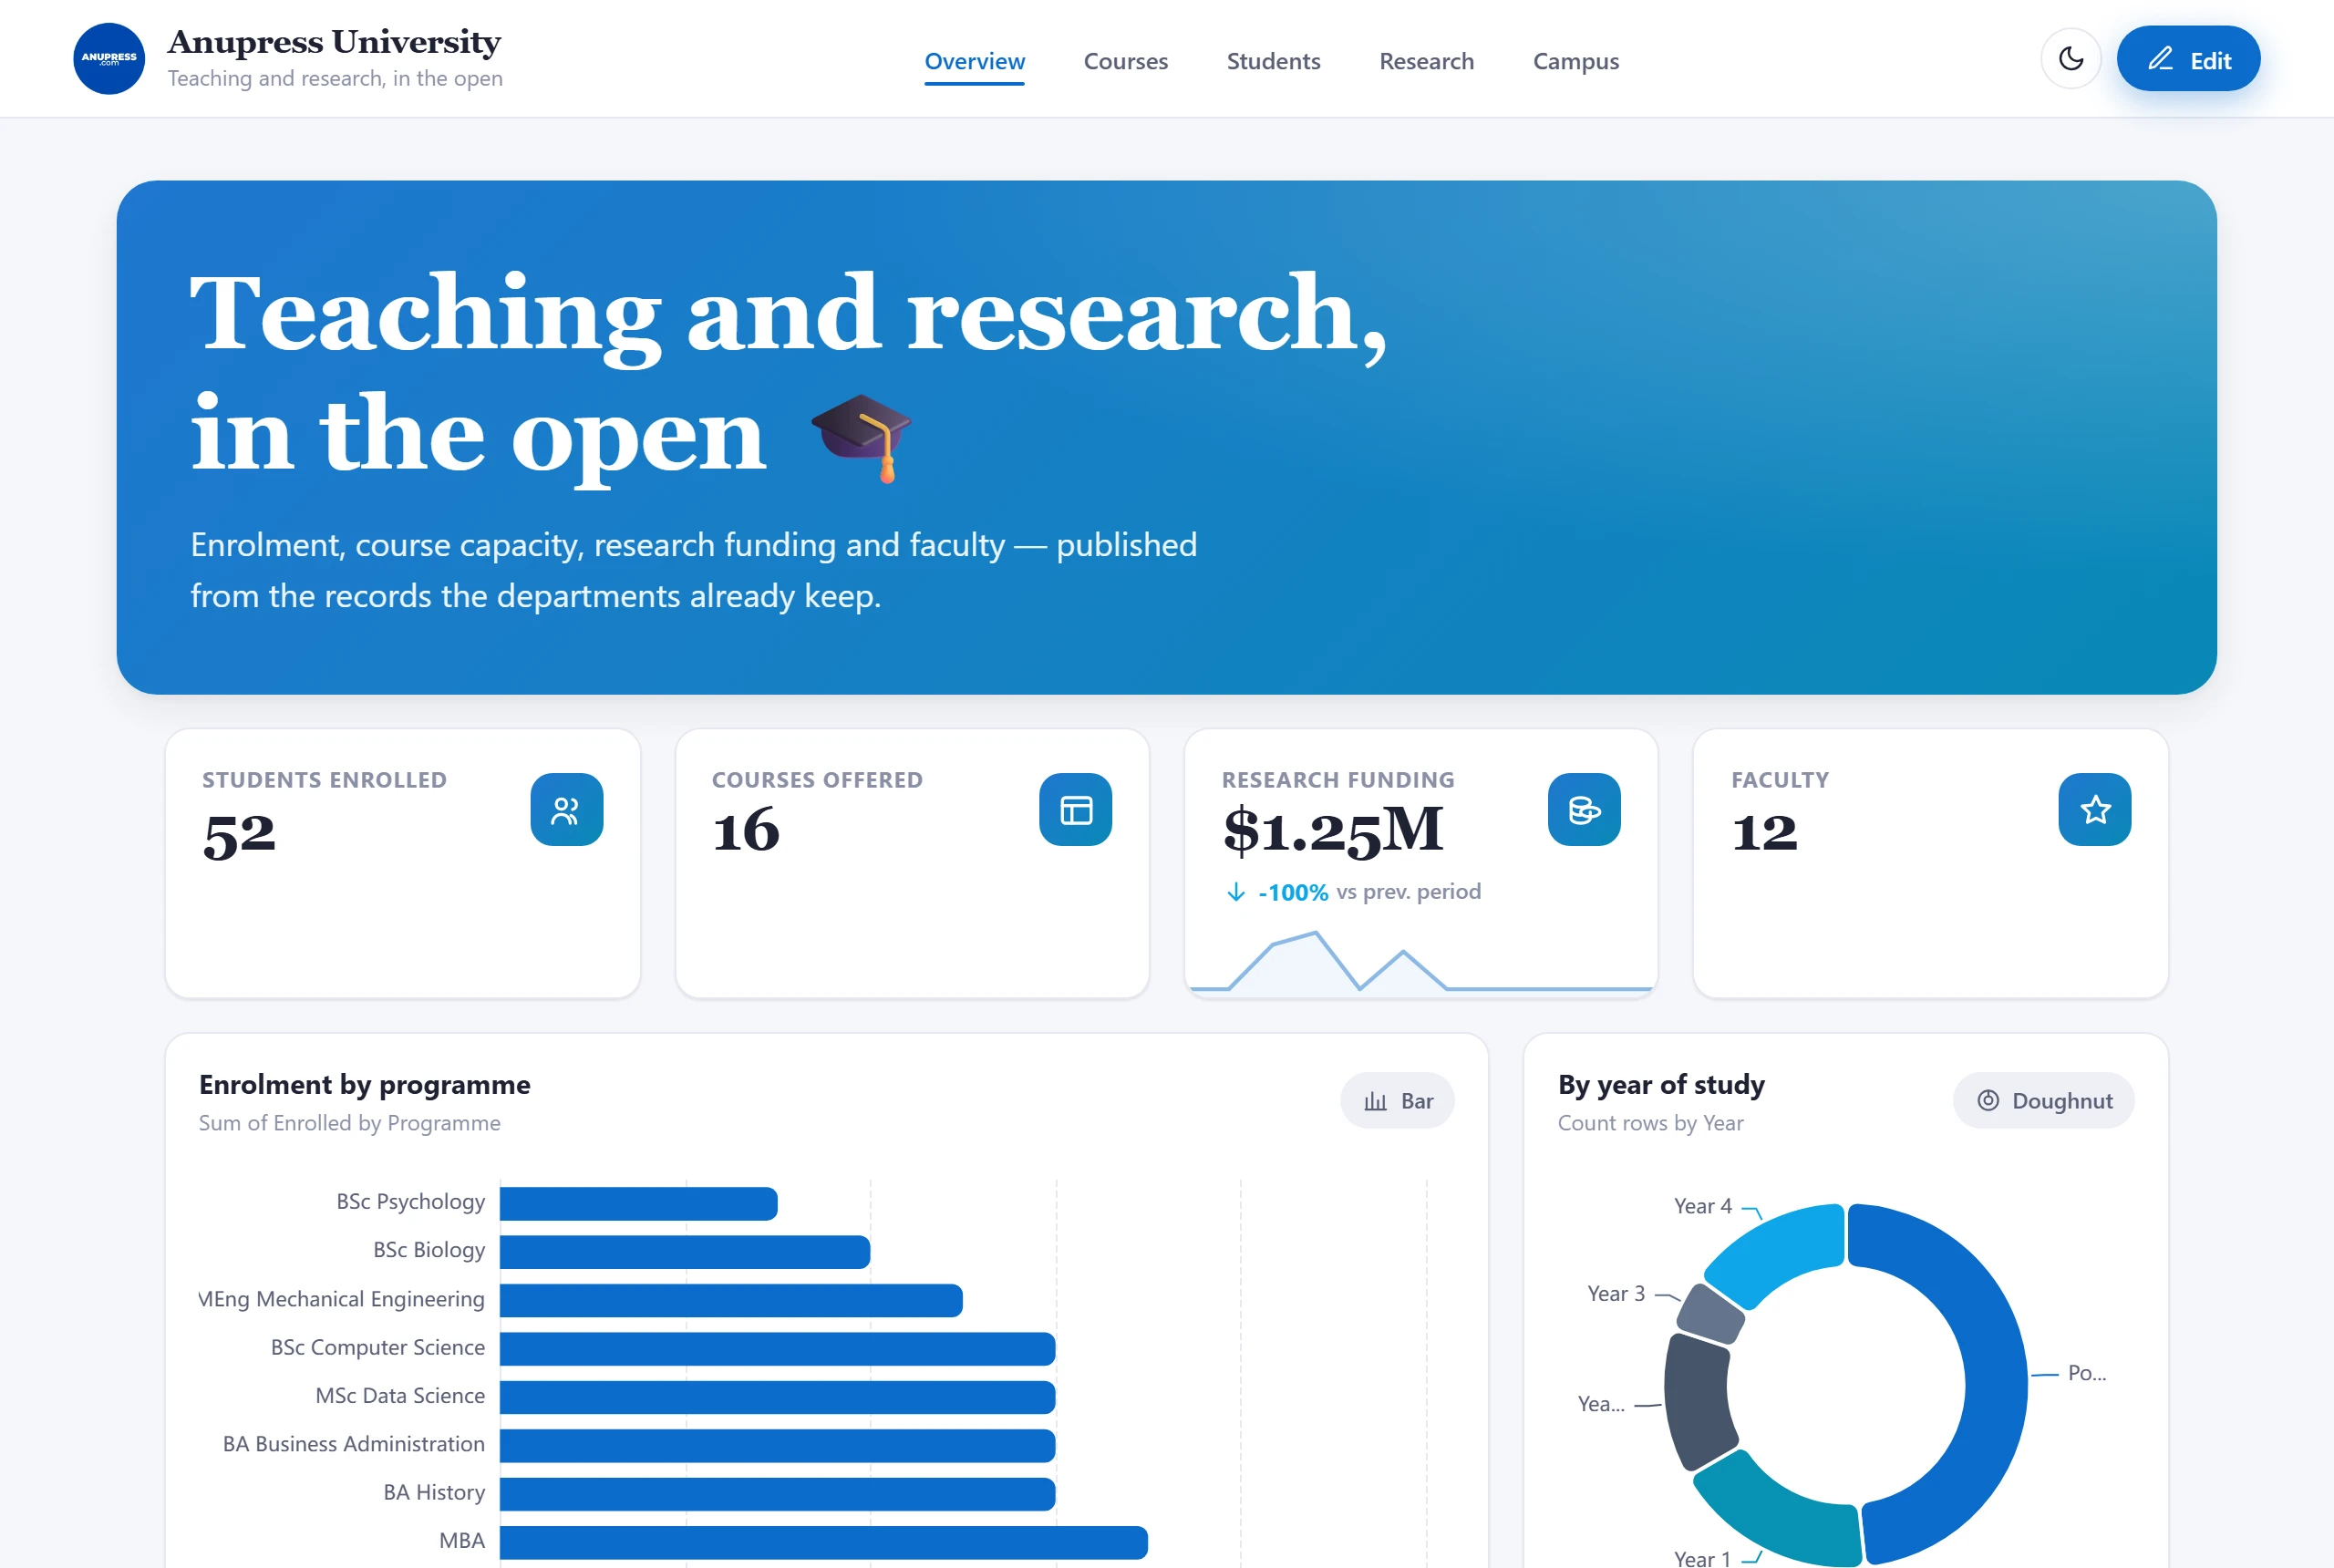
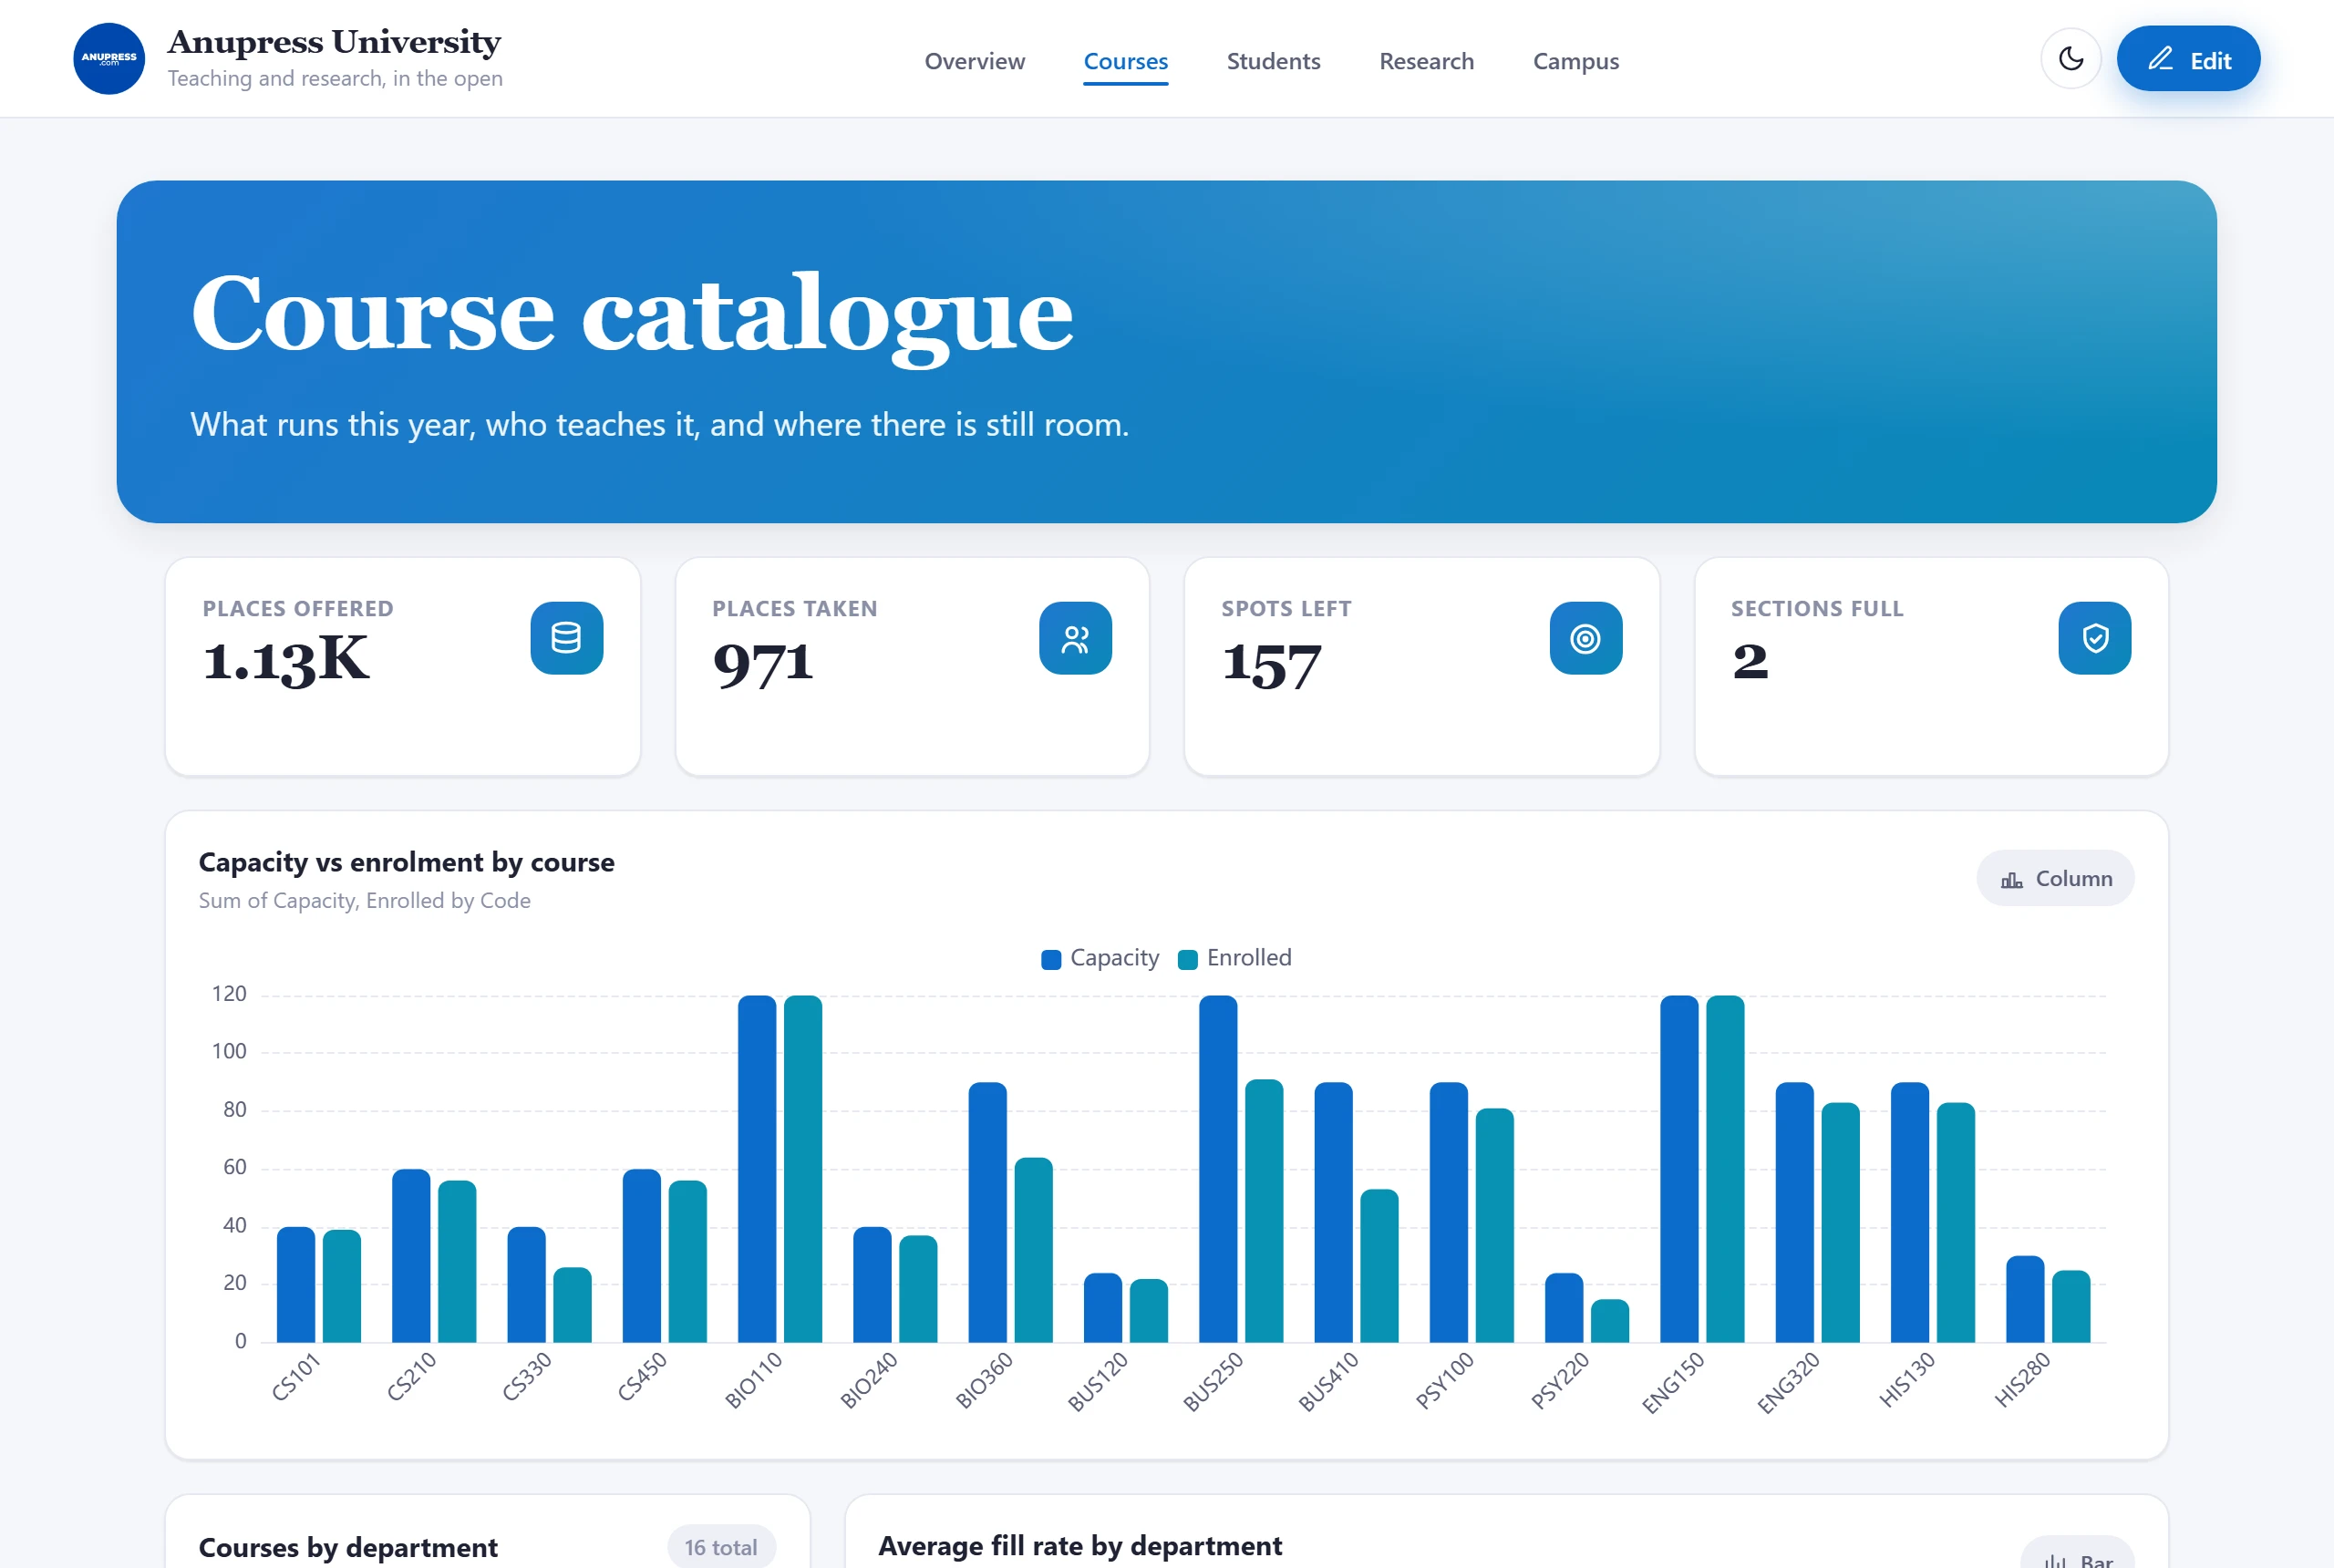
A department view rather than a university one: courses with enrolment against capacity, student counts by programme and year, research grants with values and deadlines, and a faculty directory. Enrolment versus capacity is the number this template watches most — it’s shown as utilisation, not just headcount, because “412 students” means nothing without knowing there are 450 seats.
Like the nonprofit template, it is careful about what a published page shows: aggregated counts and distributions, never an individual student’s record. That keeps a public departmental dashboard on the right side of student‑privacy rules without anyone having to think about it. Campus locations land on a map, and a Campus page carries the prospectus‑style content.
Sample tables: Courses, Students, Grants, Faculty, Departments
5. Marketing
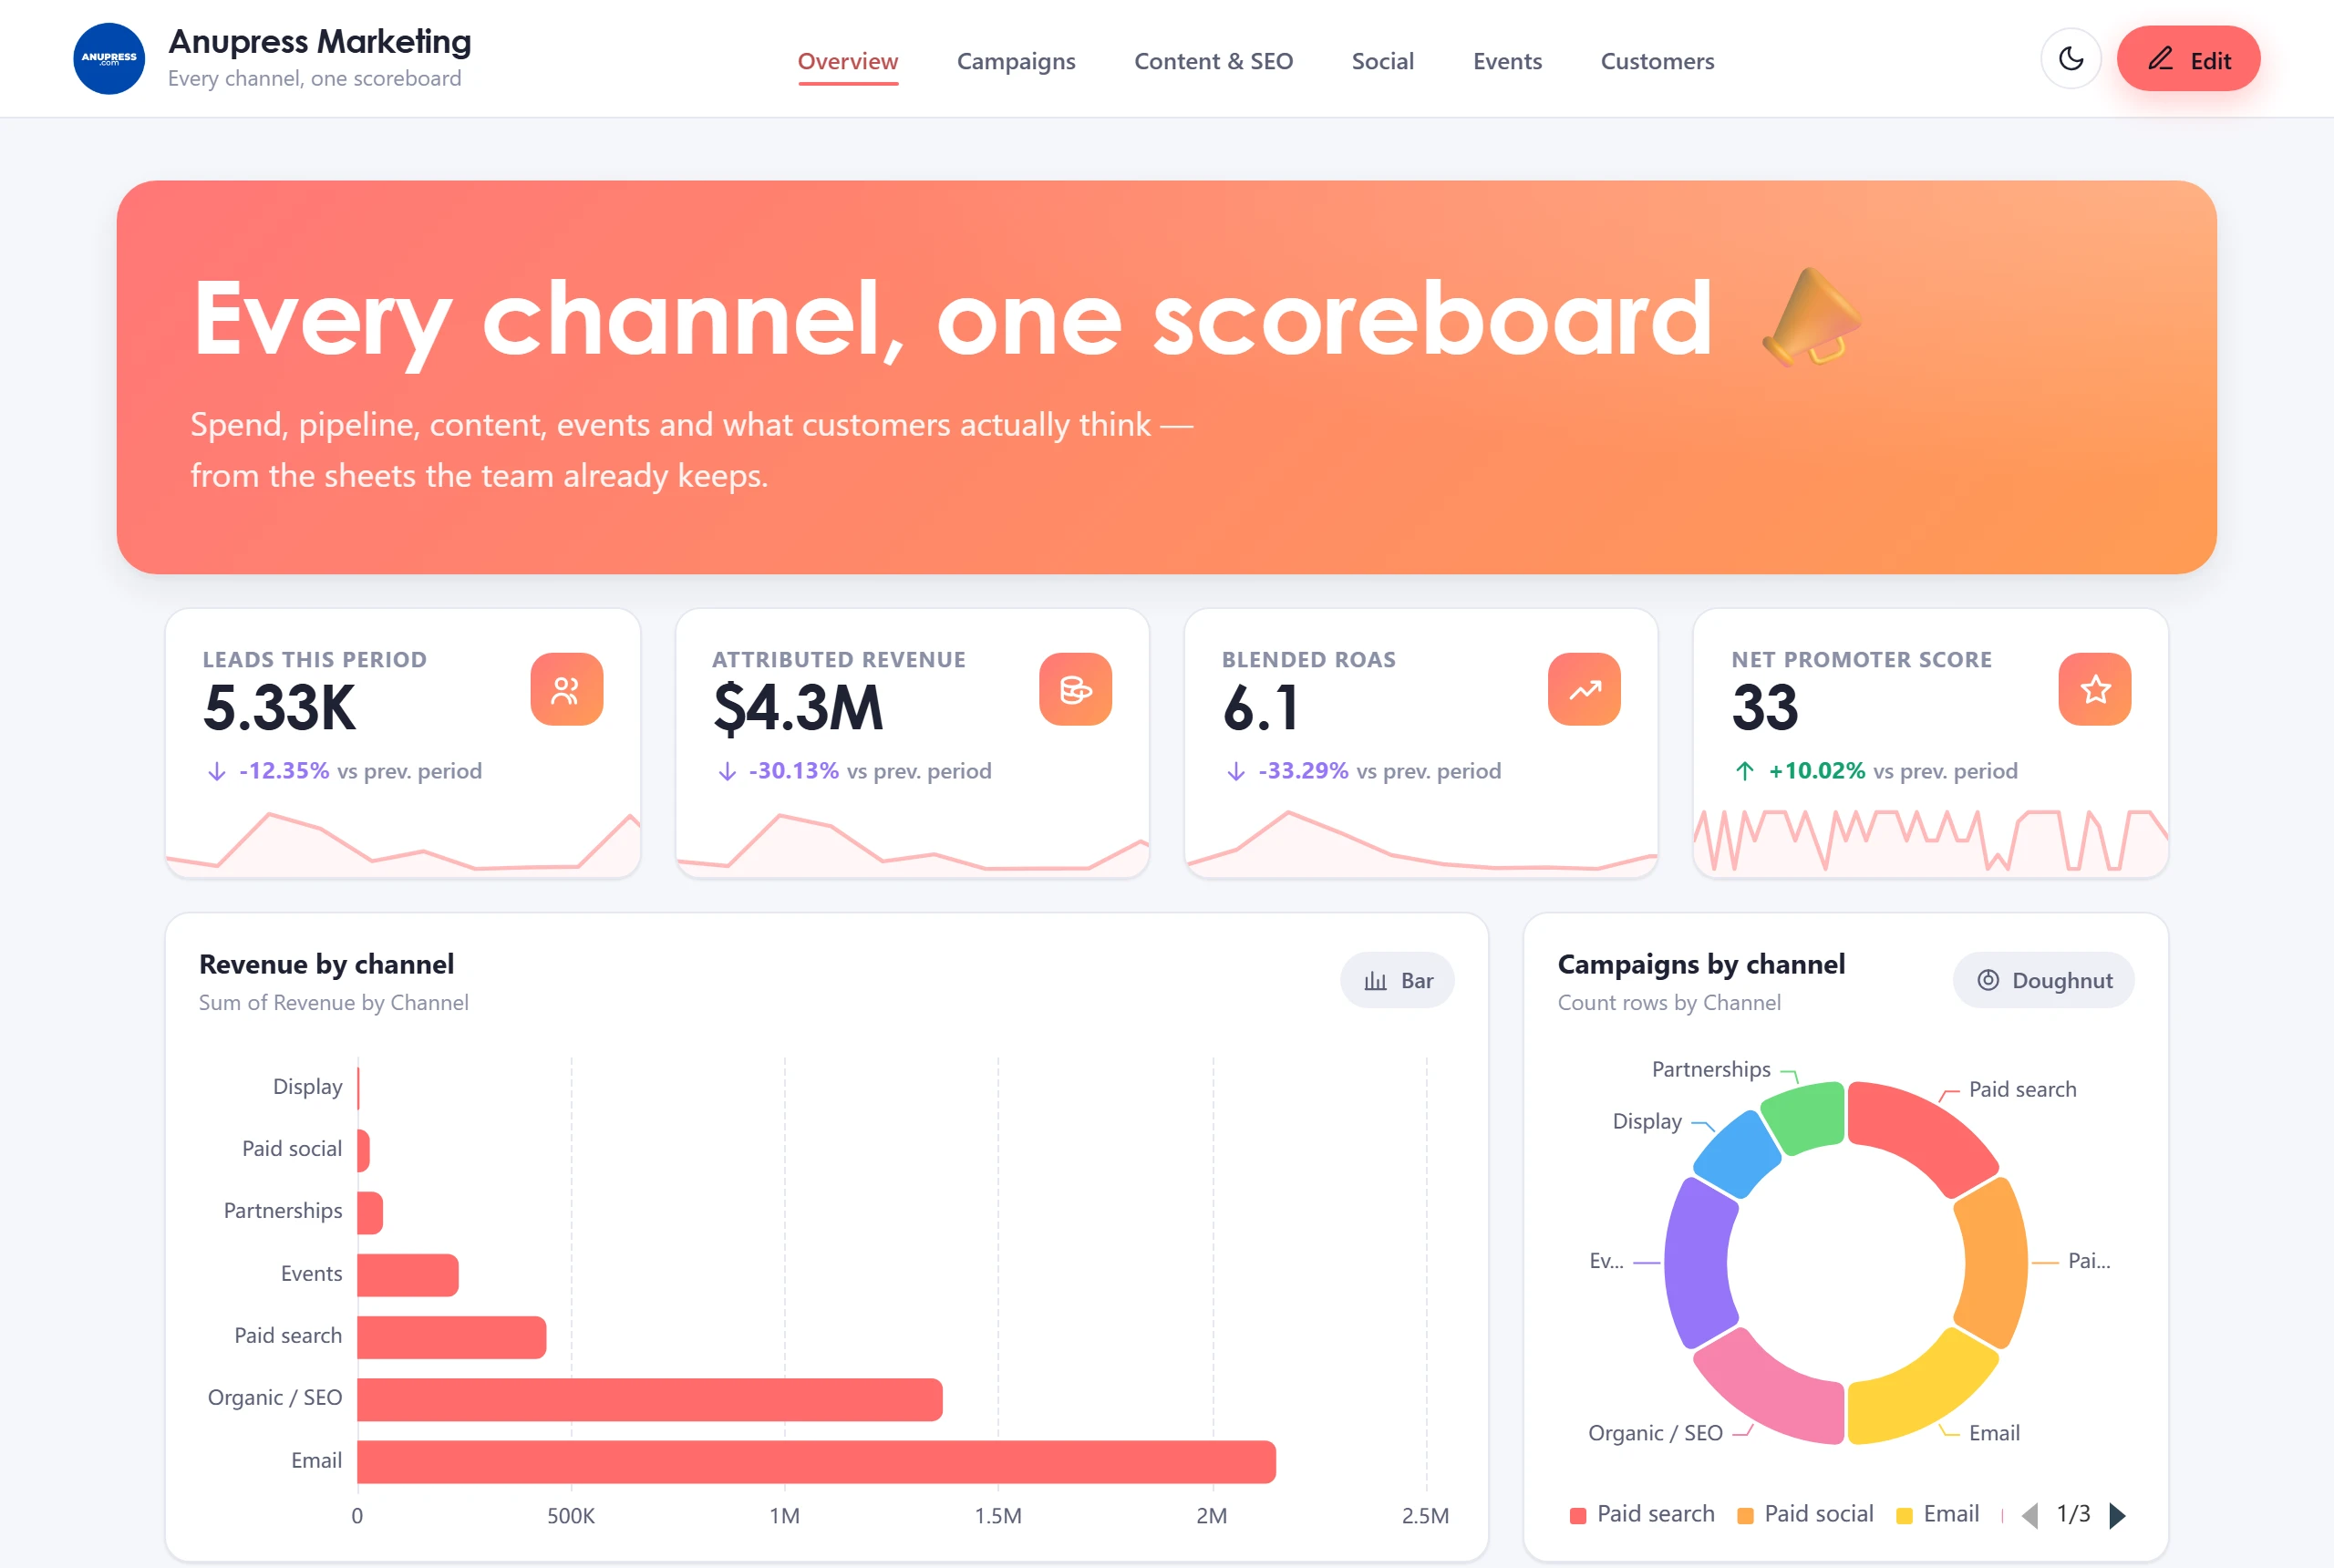
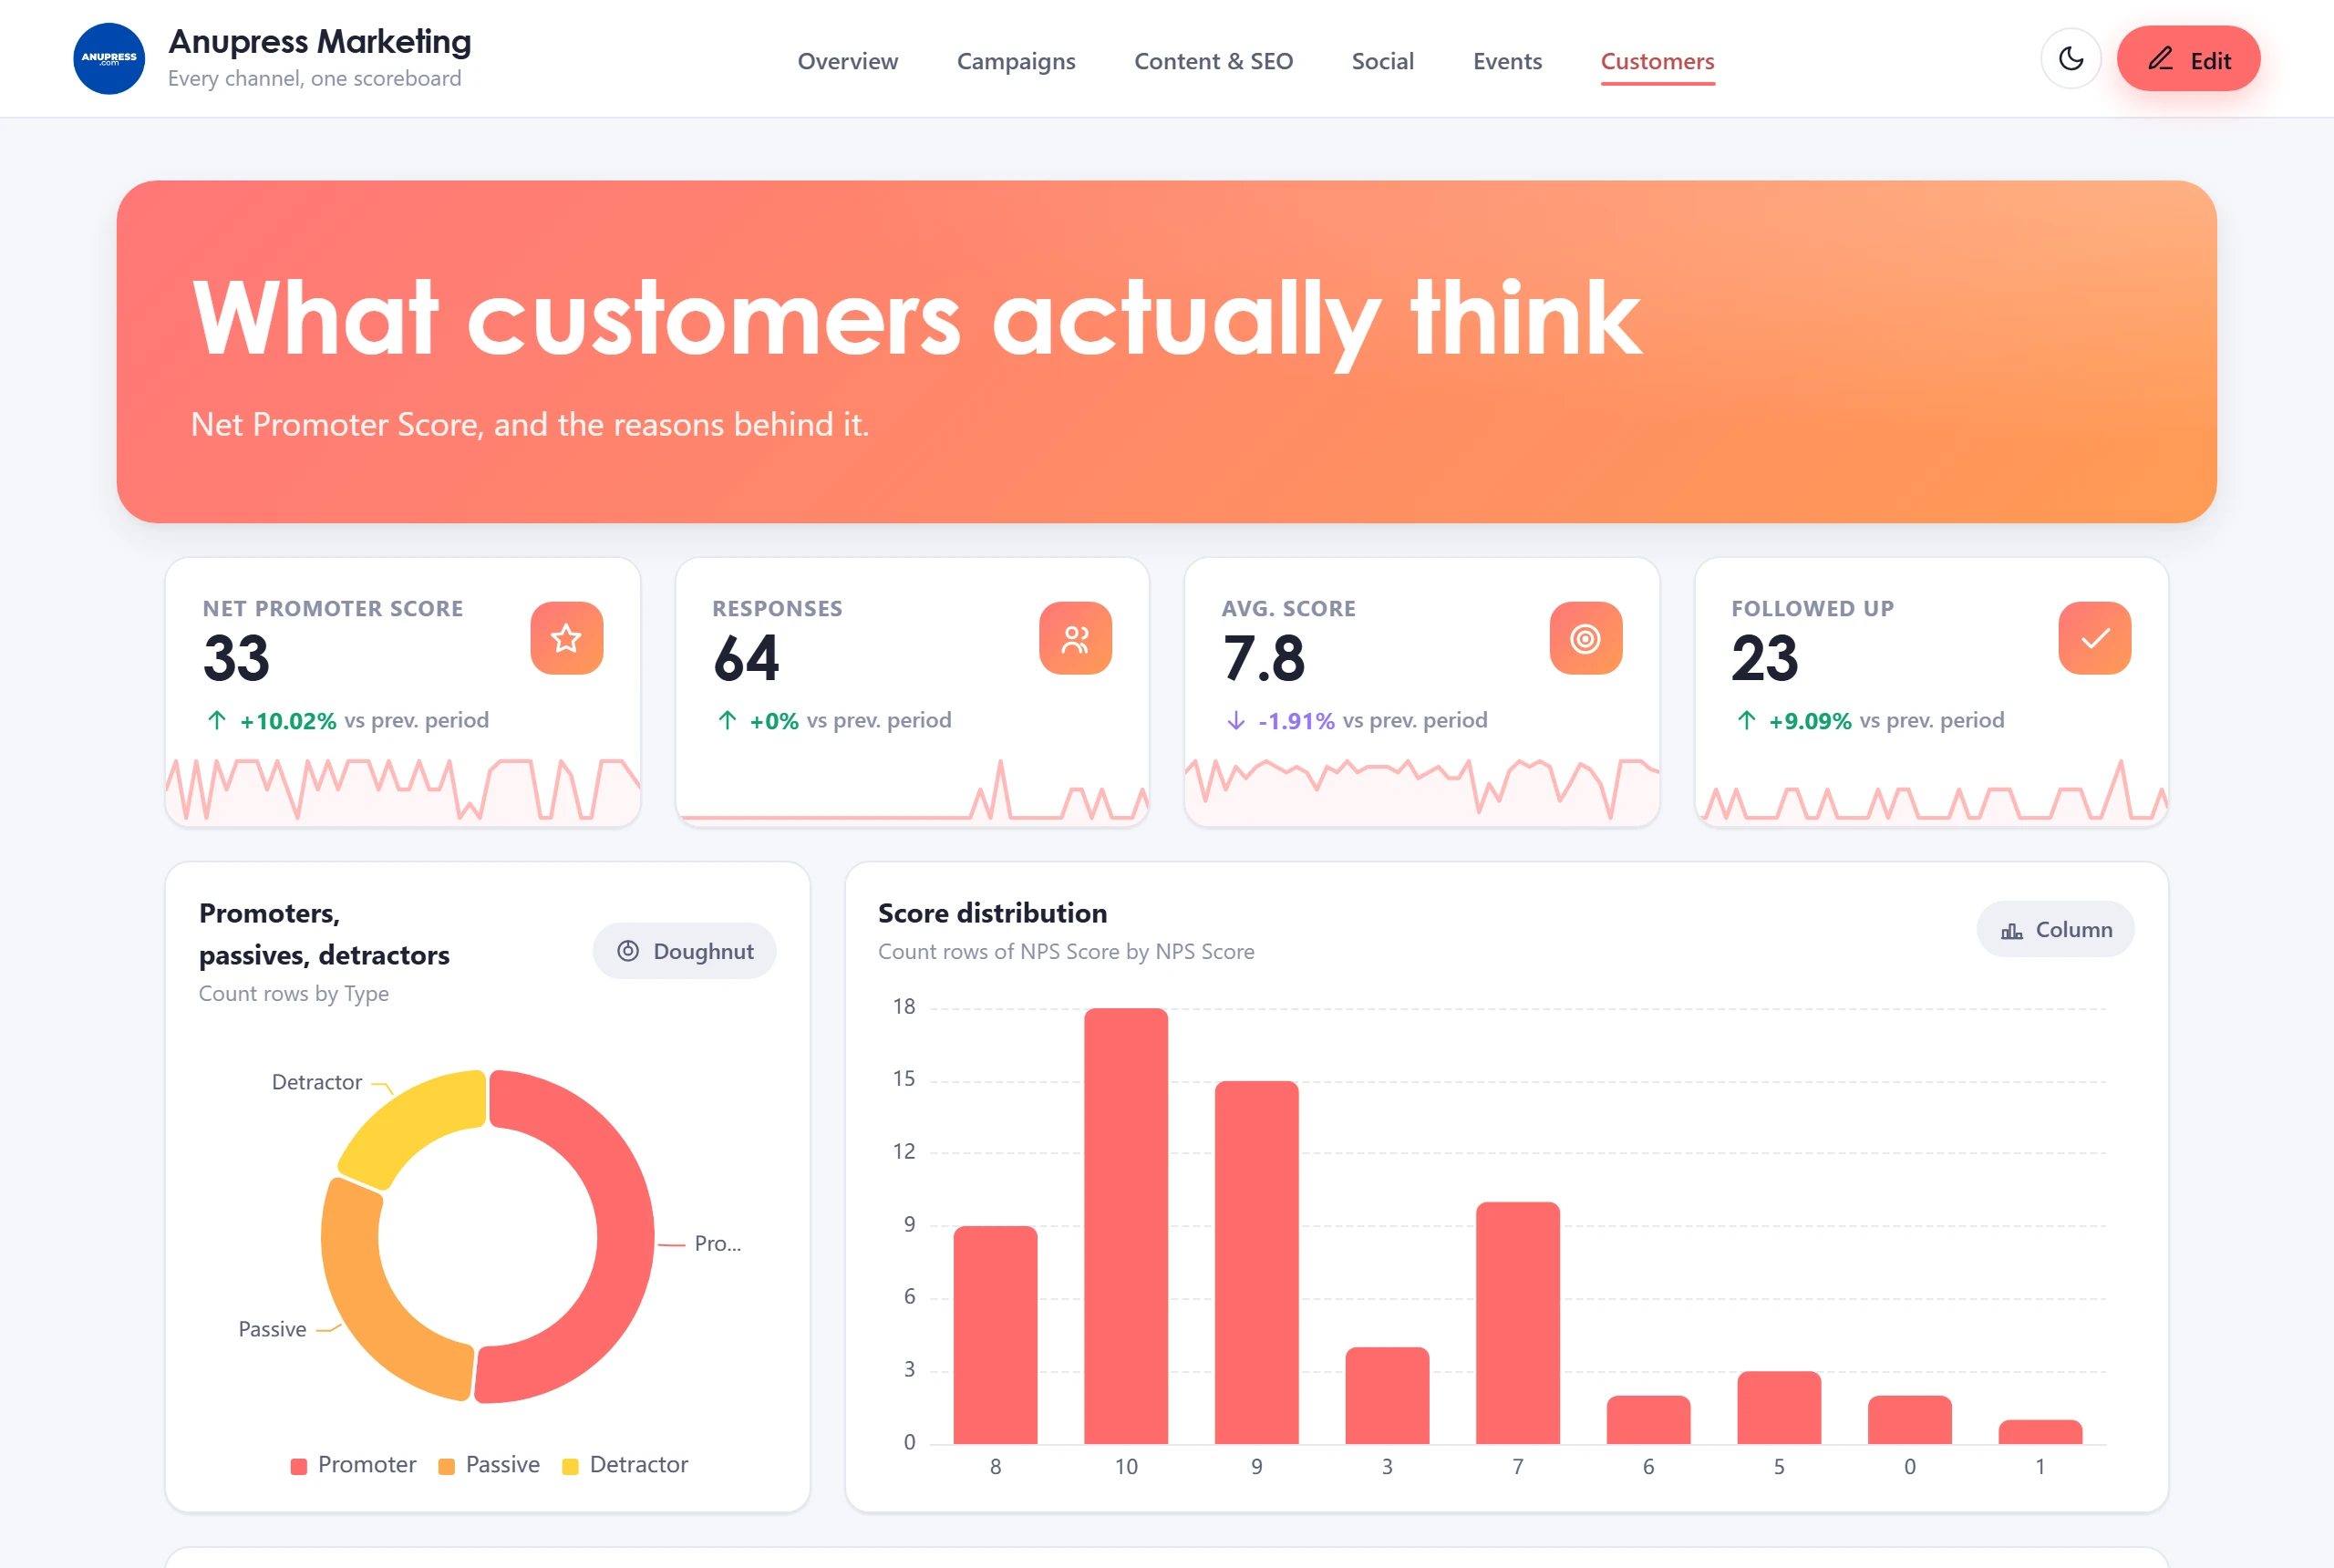
The widest template: six pages covering campaigns, content and SEO, social posts, events and customer feedback. Campaign cards report spend against return, the content page ranks what actually got read, and events track cost per lead rather than cost alone.
The feedback page has a neat trick under the hood. NPS is normally awkward for a dashboard tool because it’s a percentage difference, not an average — so the sample table carries a points column (promoter = 100, passive = 0, detractor = −100) and a plain average of that column is the NPS. If you wire the template to your own feedback table, copy that one formula column and the score stays honest.
Sample tables: Campaigns, Content, Posts, Events, Feedback
6. Finance & Accounting
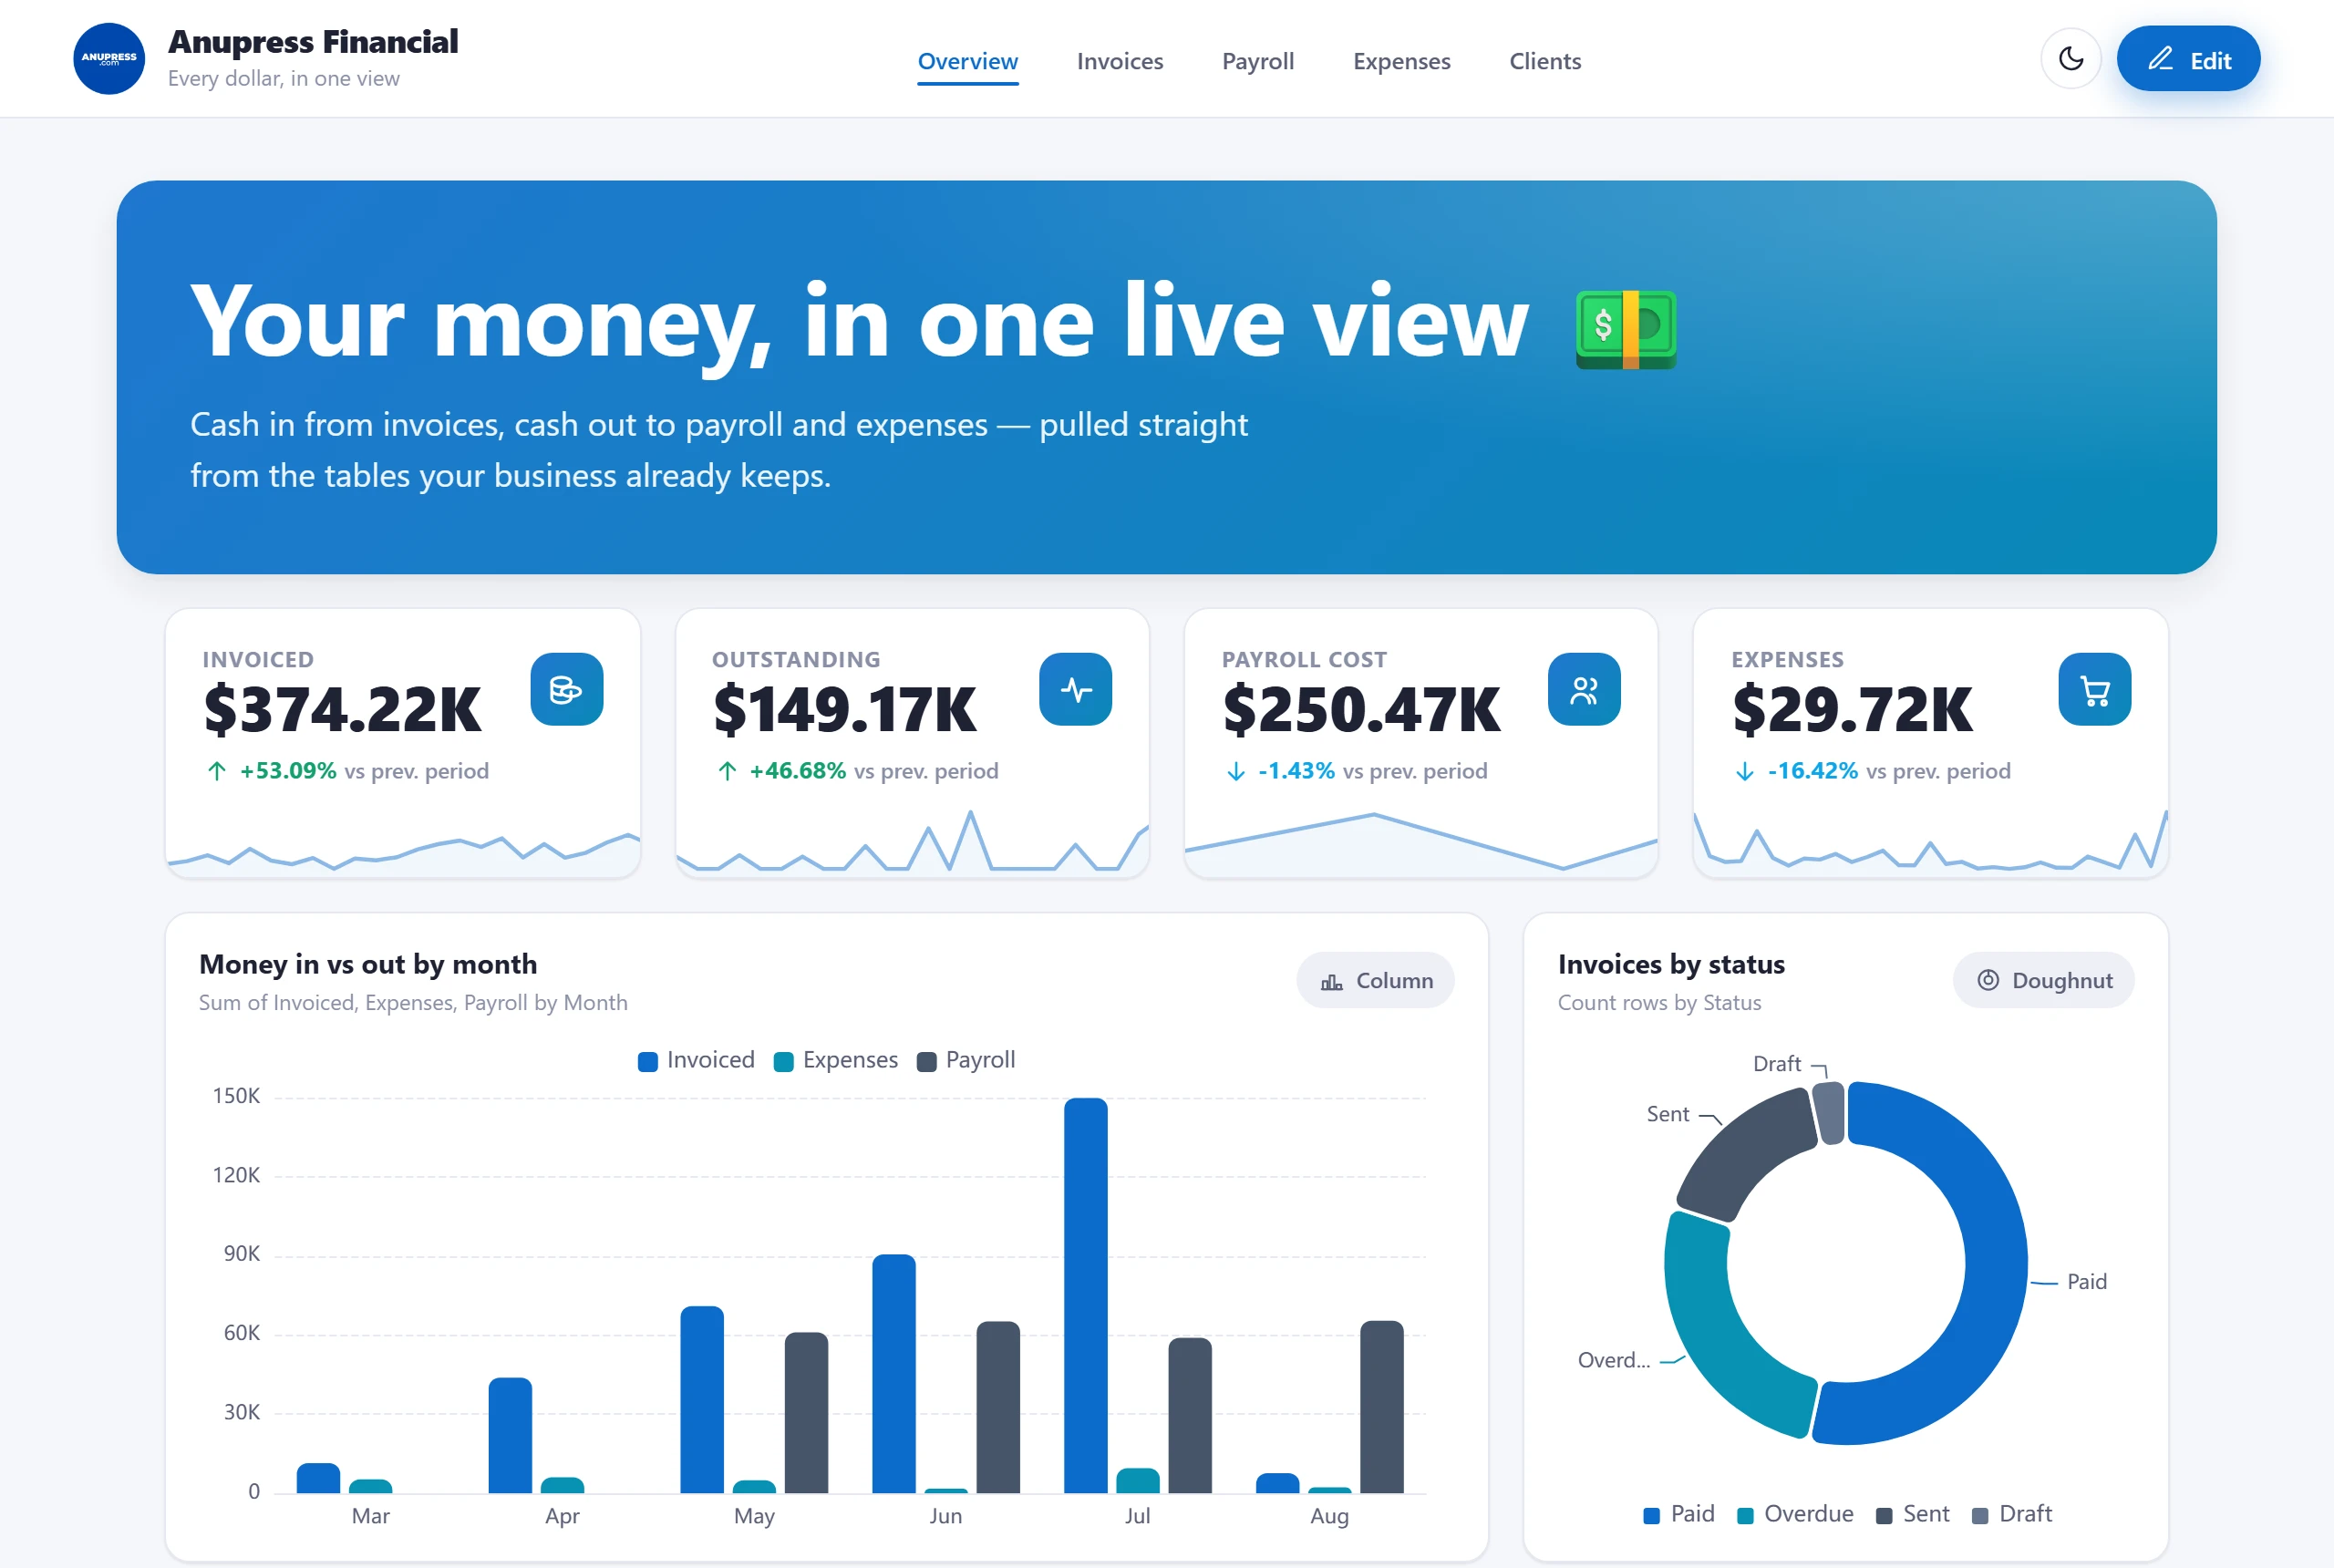
Grist’s own template gallery keeps invoicing, payroll and expenses in three separate documents. This template’s whole point is the opposite: one cockpit where money in and money out share a page. The overview pairs invoiced against outstanding, payroll cost against expenses, and a “money in vs out by month” column chart that answers the only question that really matters at a glance.
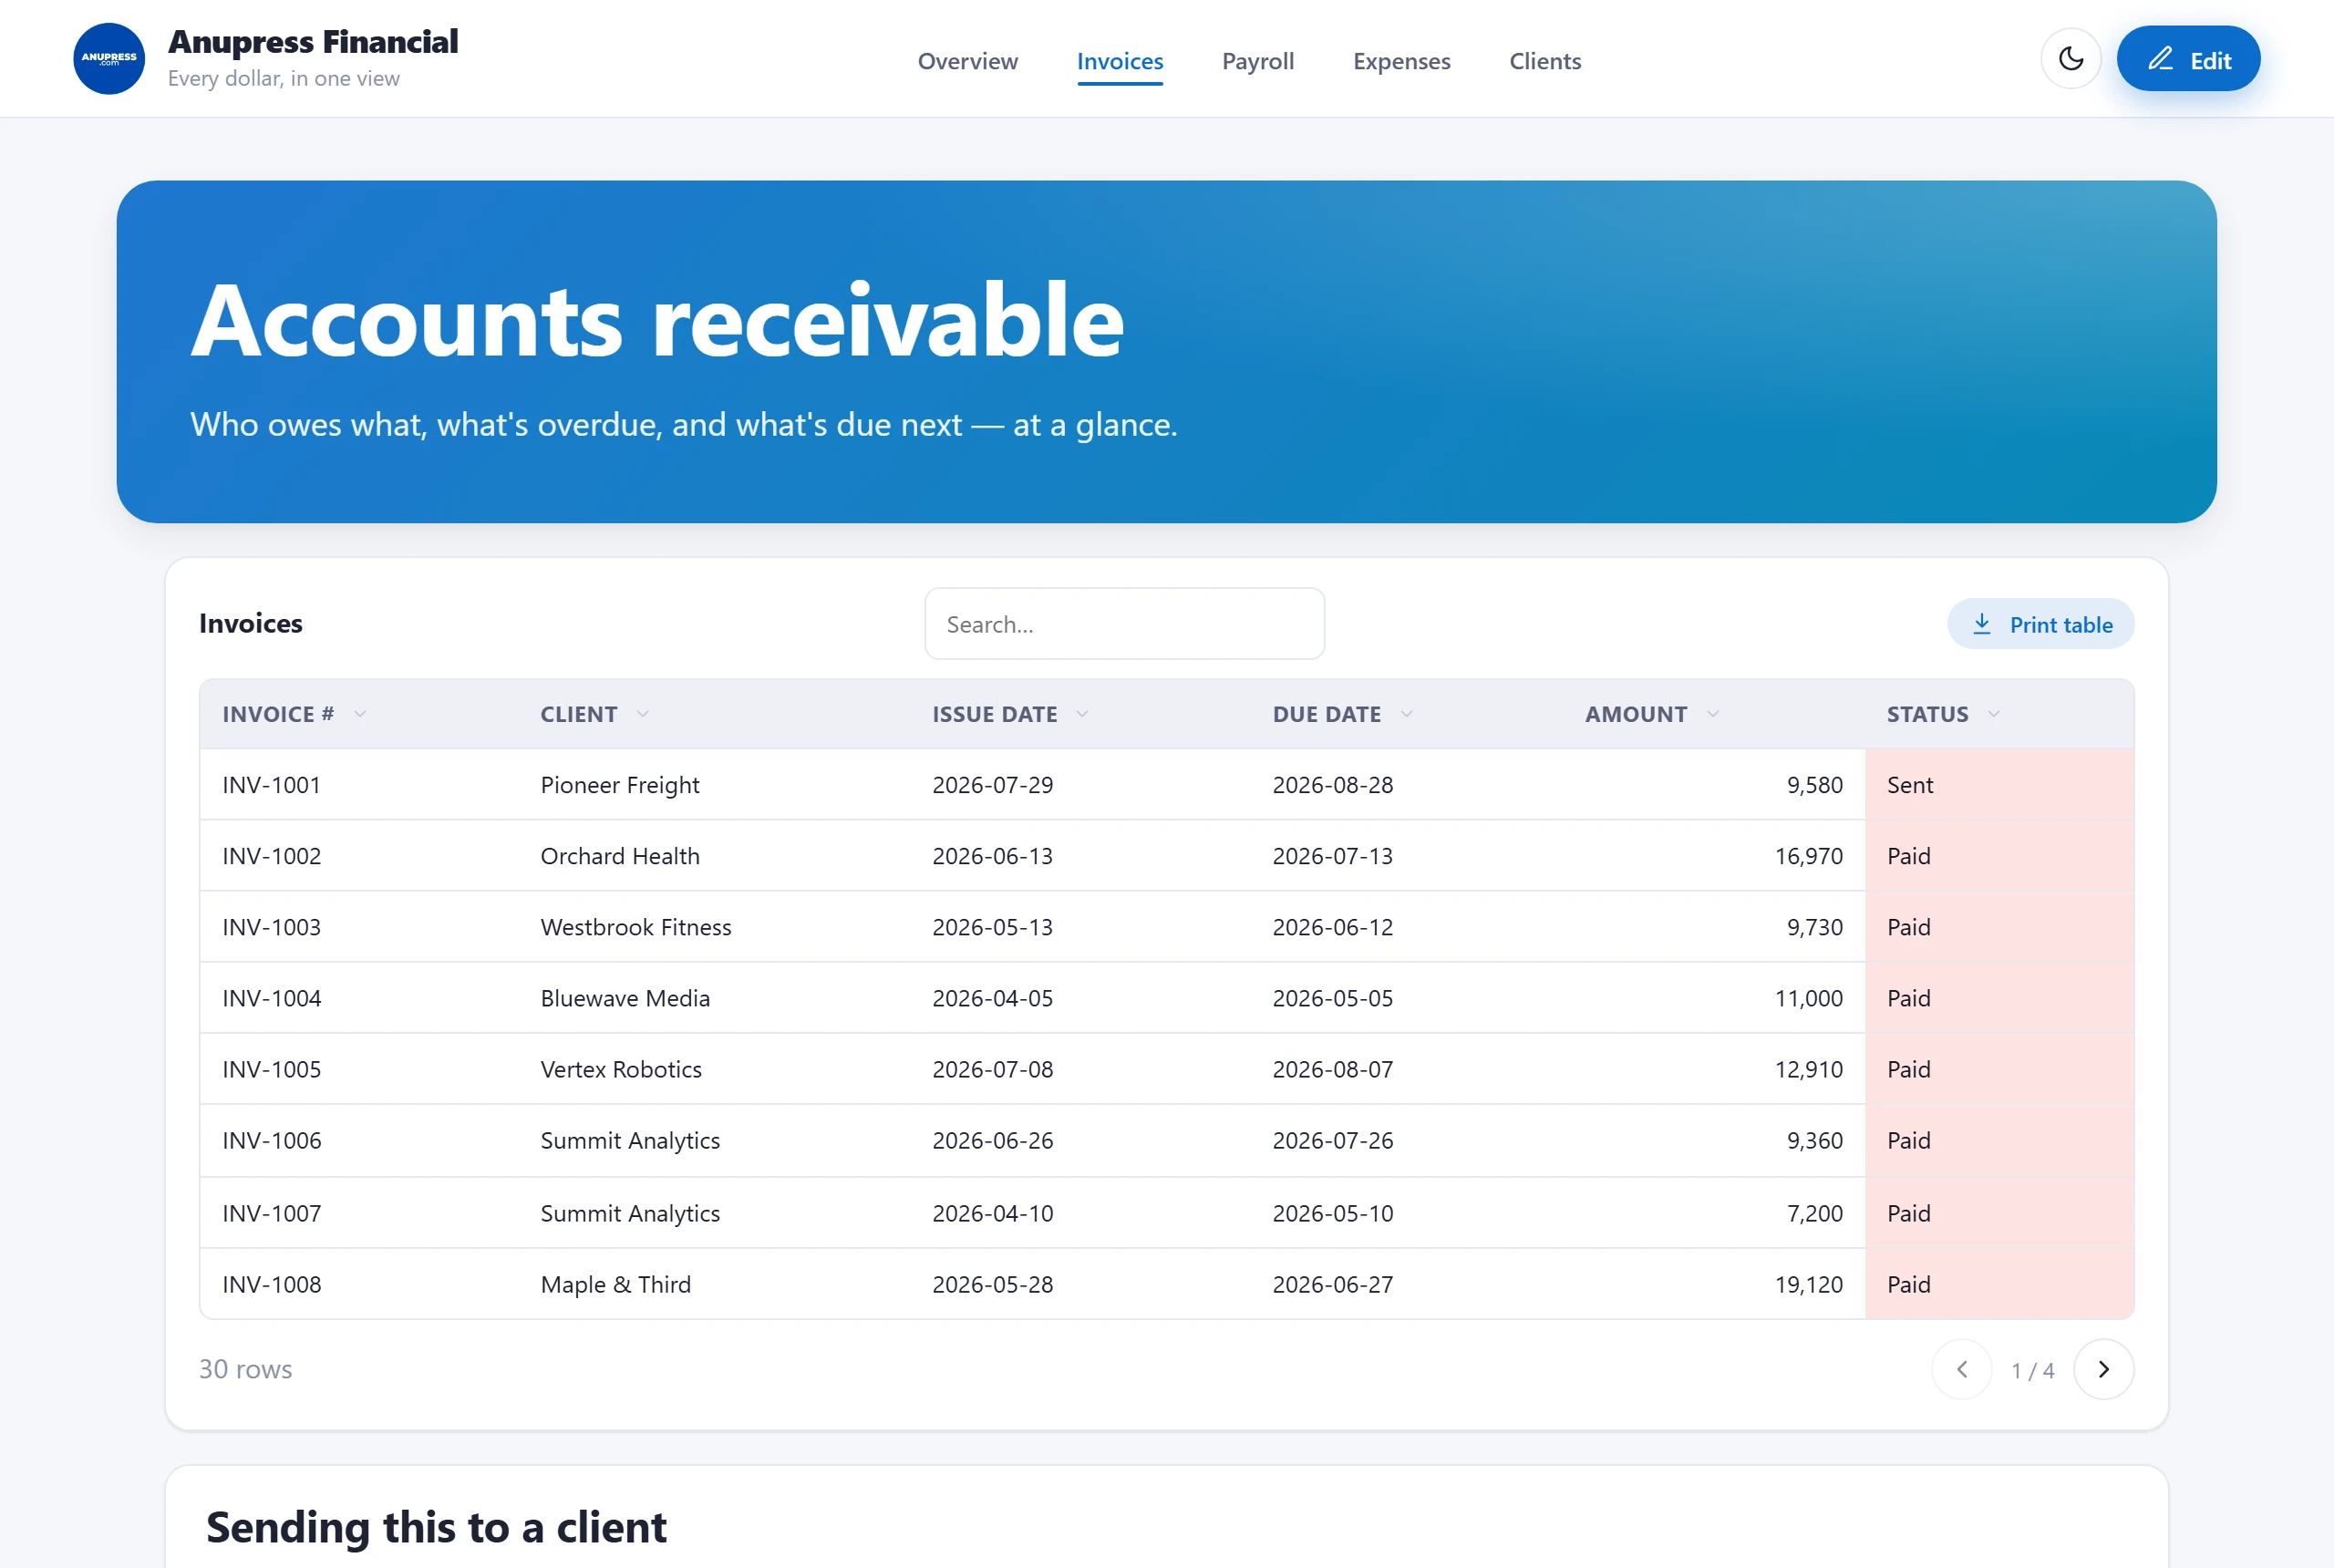
Each stream still gets its own page — invoices by status with a printable invoice document, payroll by month, expenses by category — plus a client list. If you already keep any of these tables, point the template at yours during install and skip the sample data for that one.
The invoice table this template reads is the same one our Grist invoice widget writes. Put the two on the same document and the cockpit shows what Invoice Studio has just sent, including which invoices are overdue.
Sample tables: Invoices, Payroll, Expenses, Clients, CashFlow
7. Developers
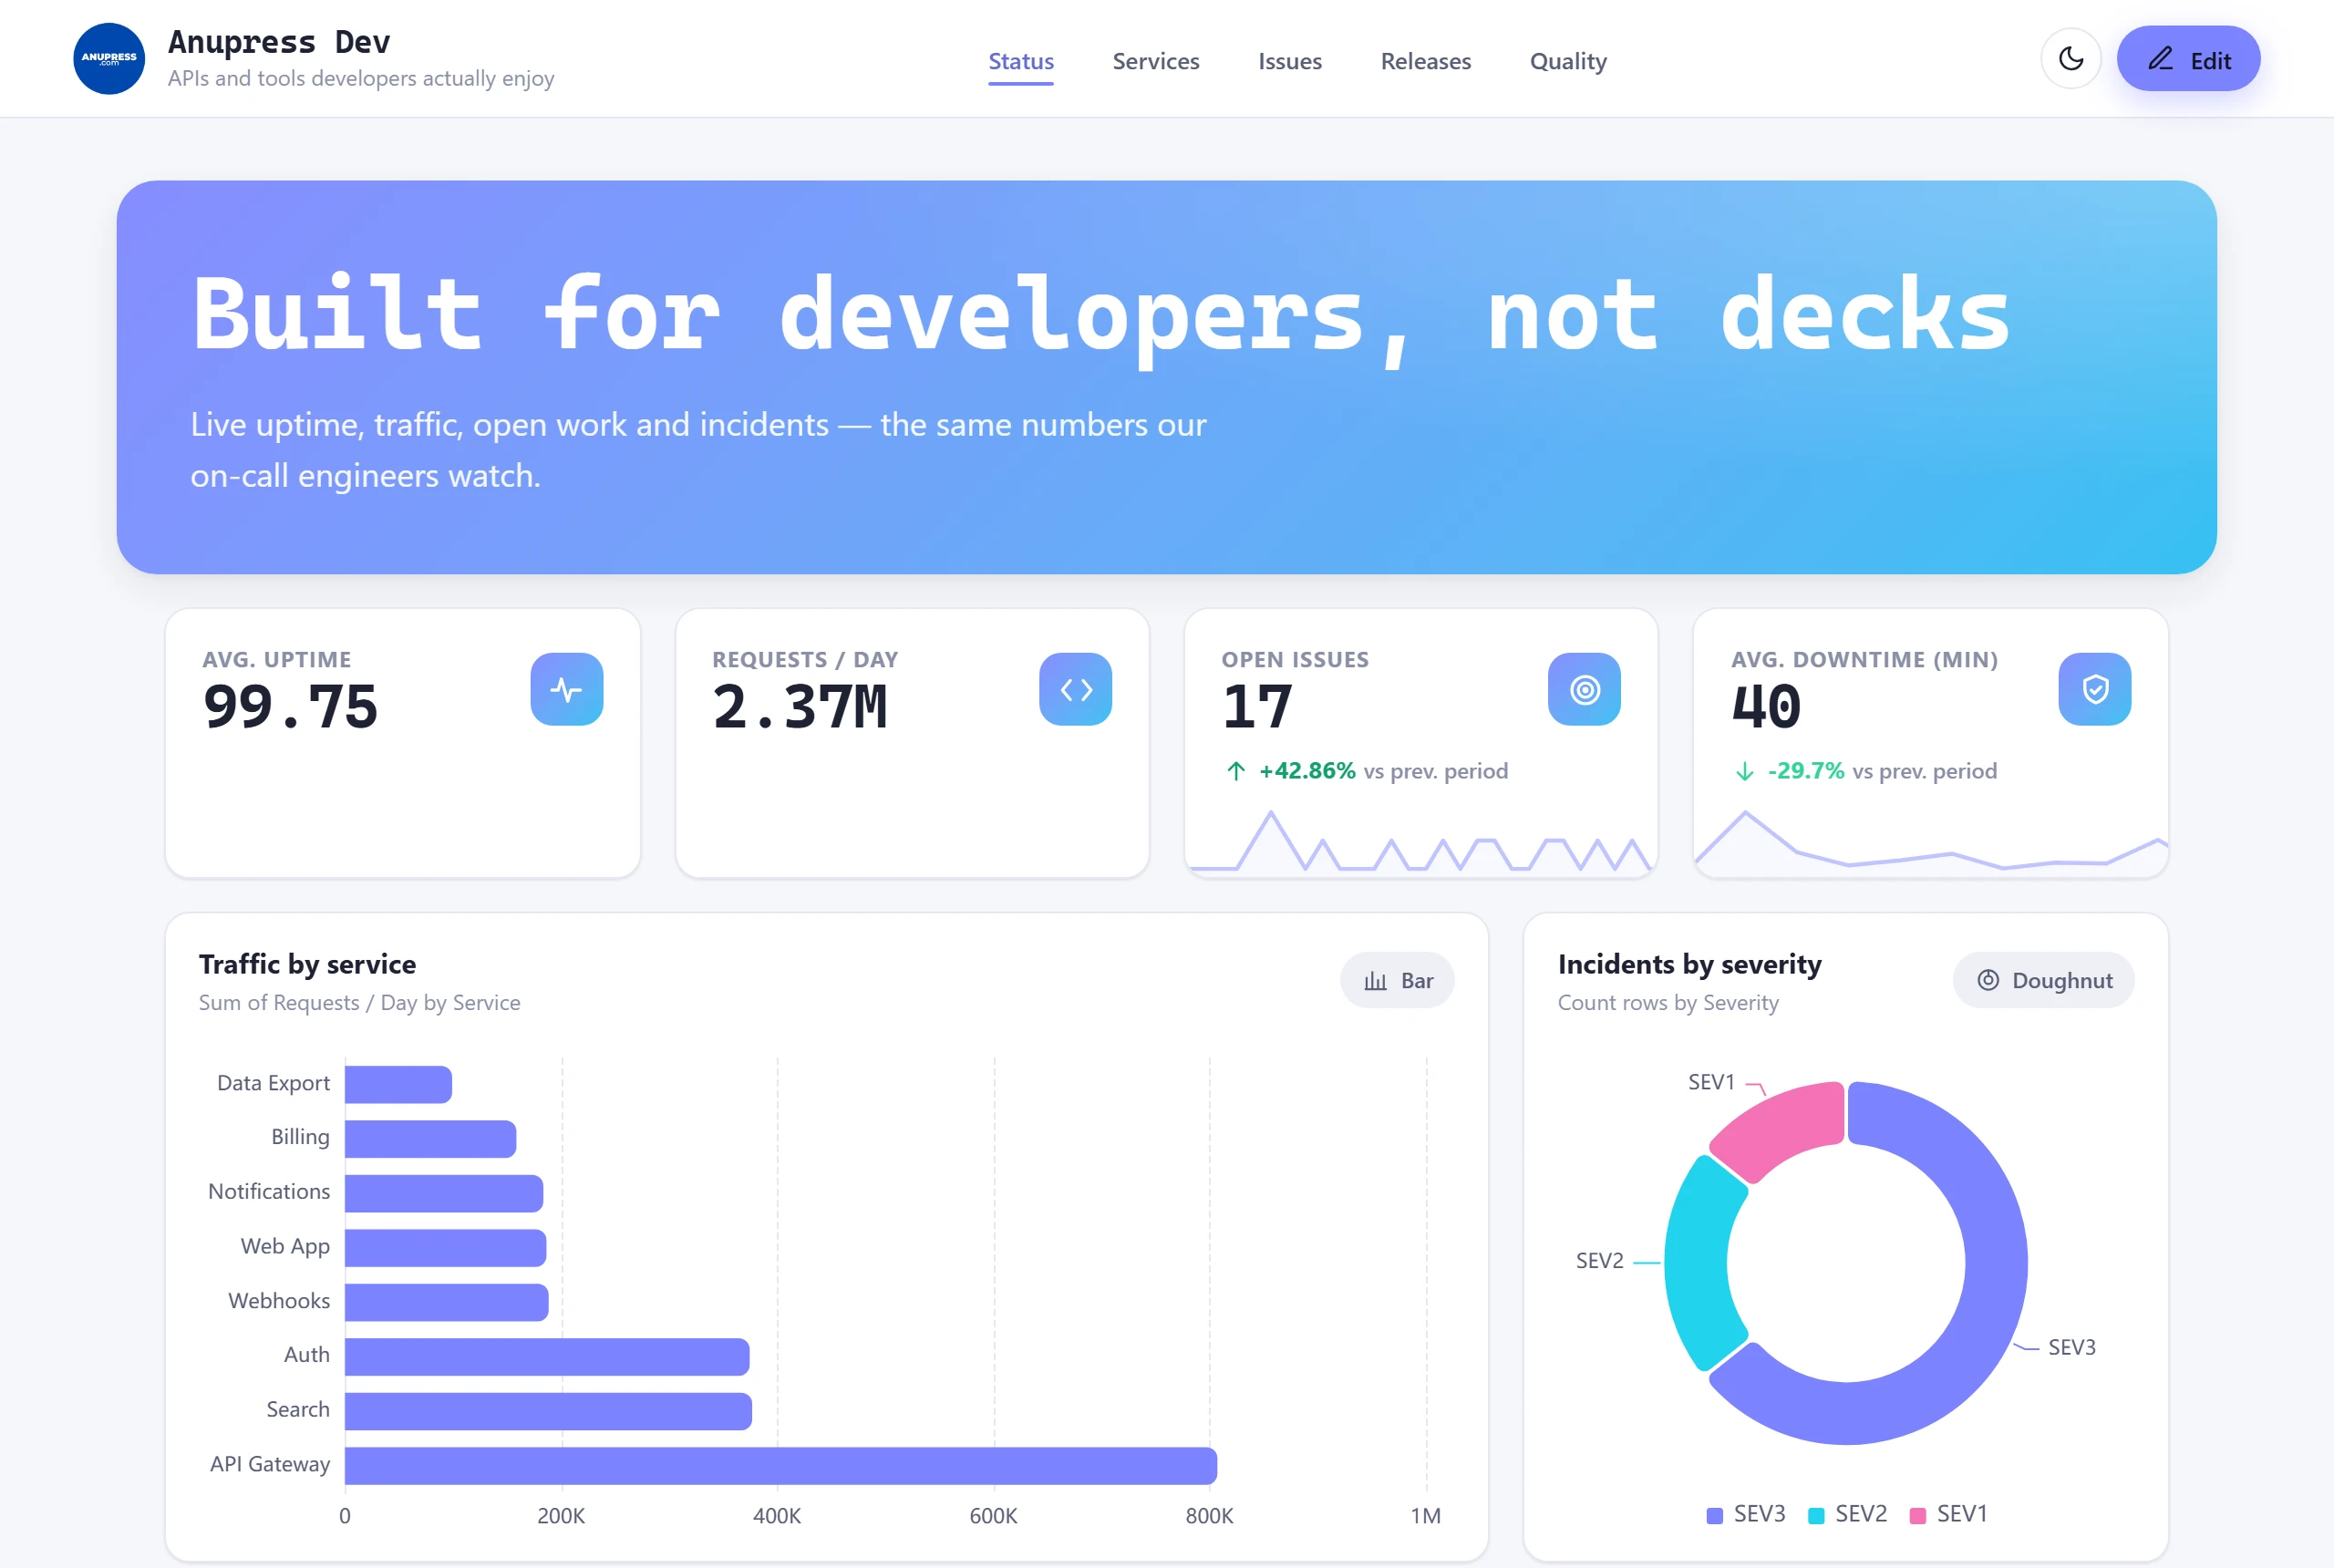
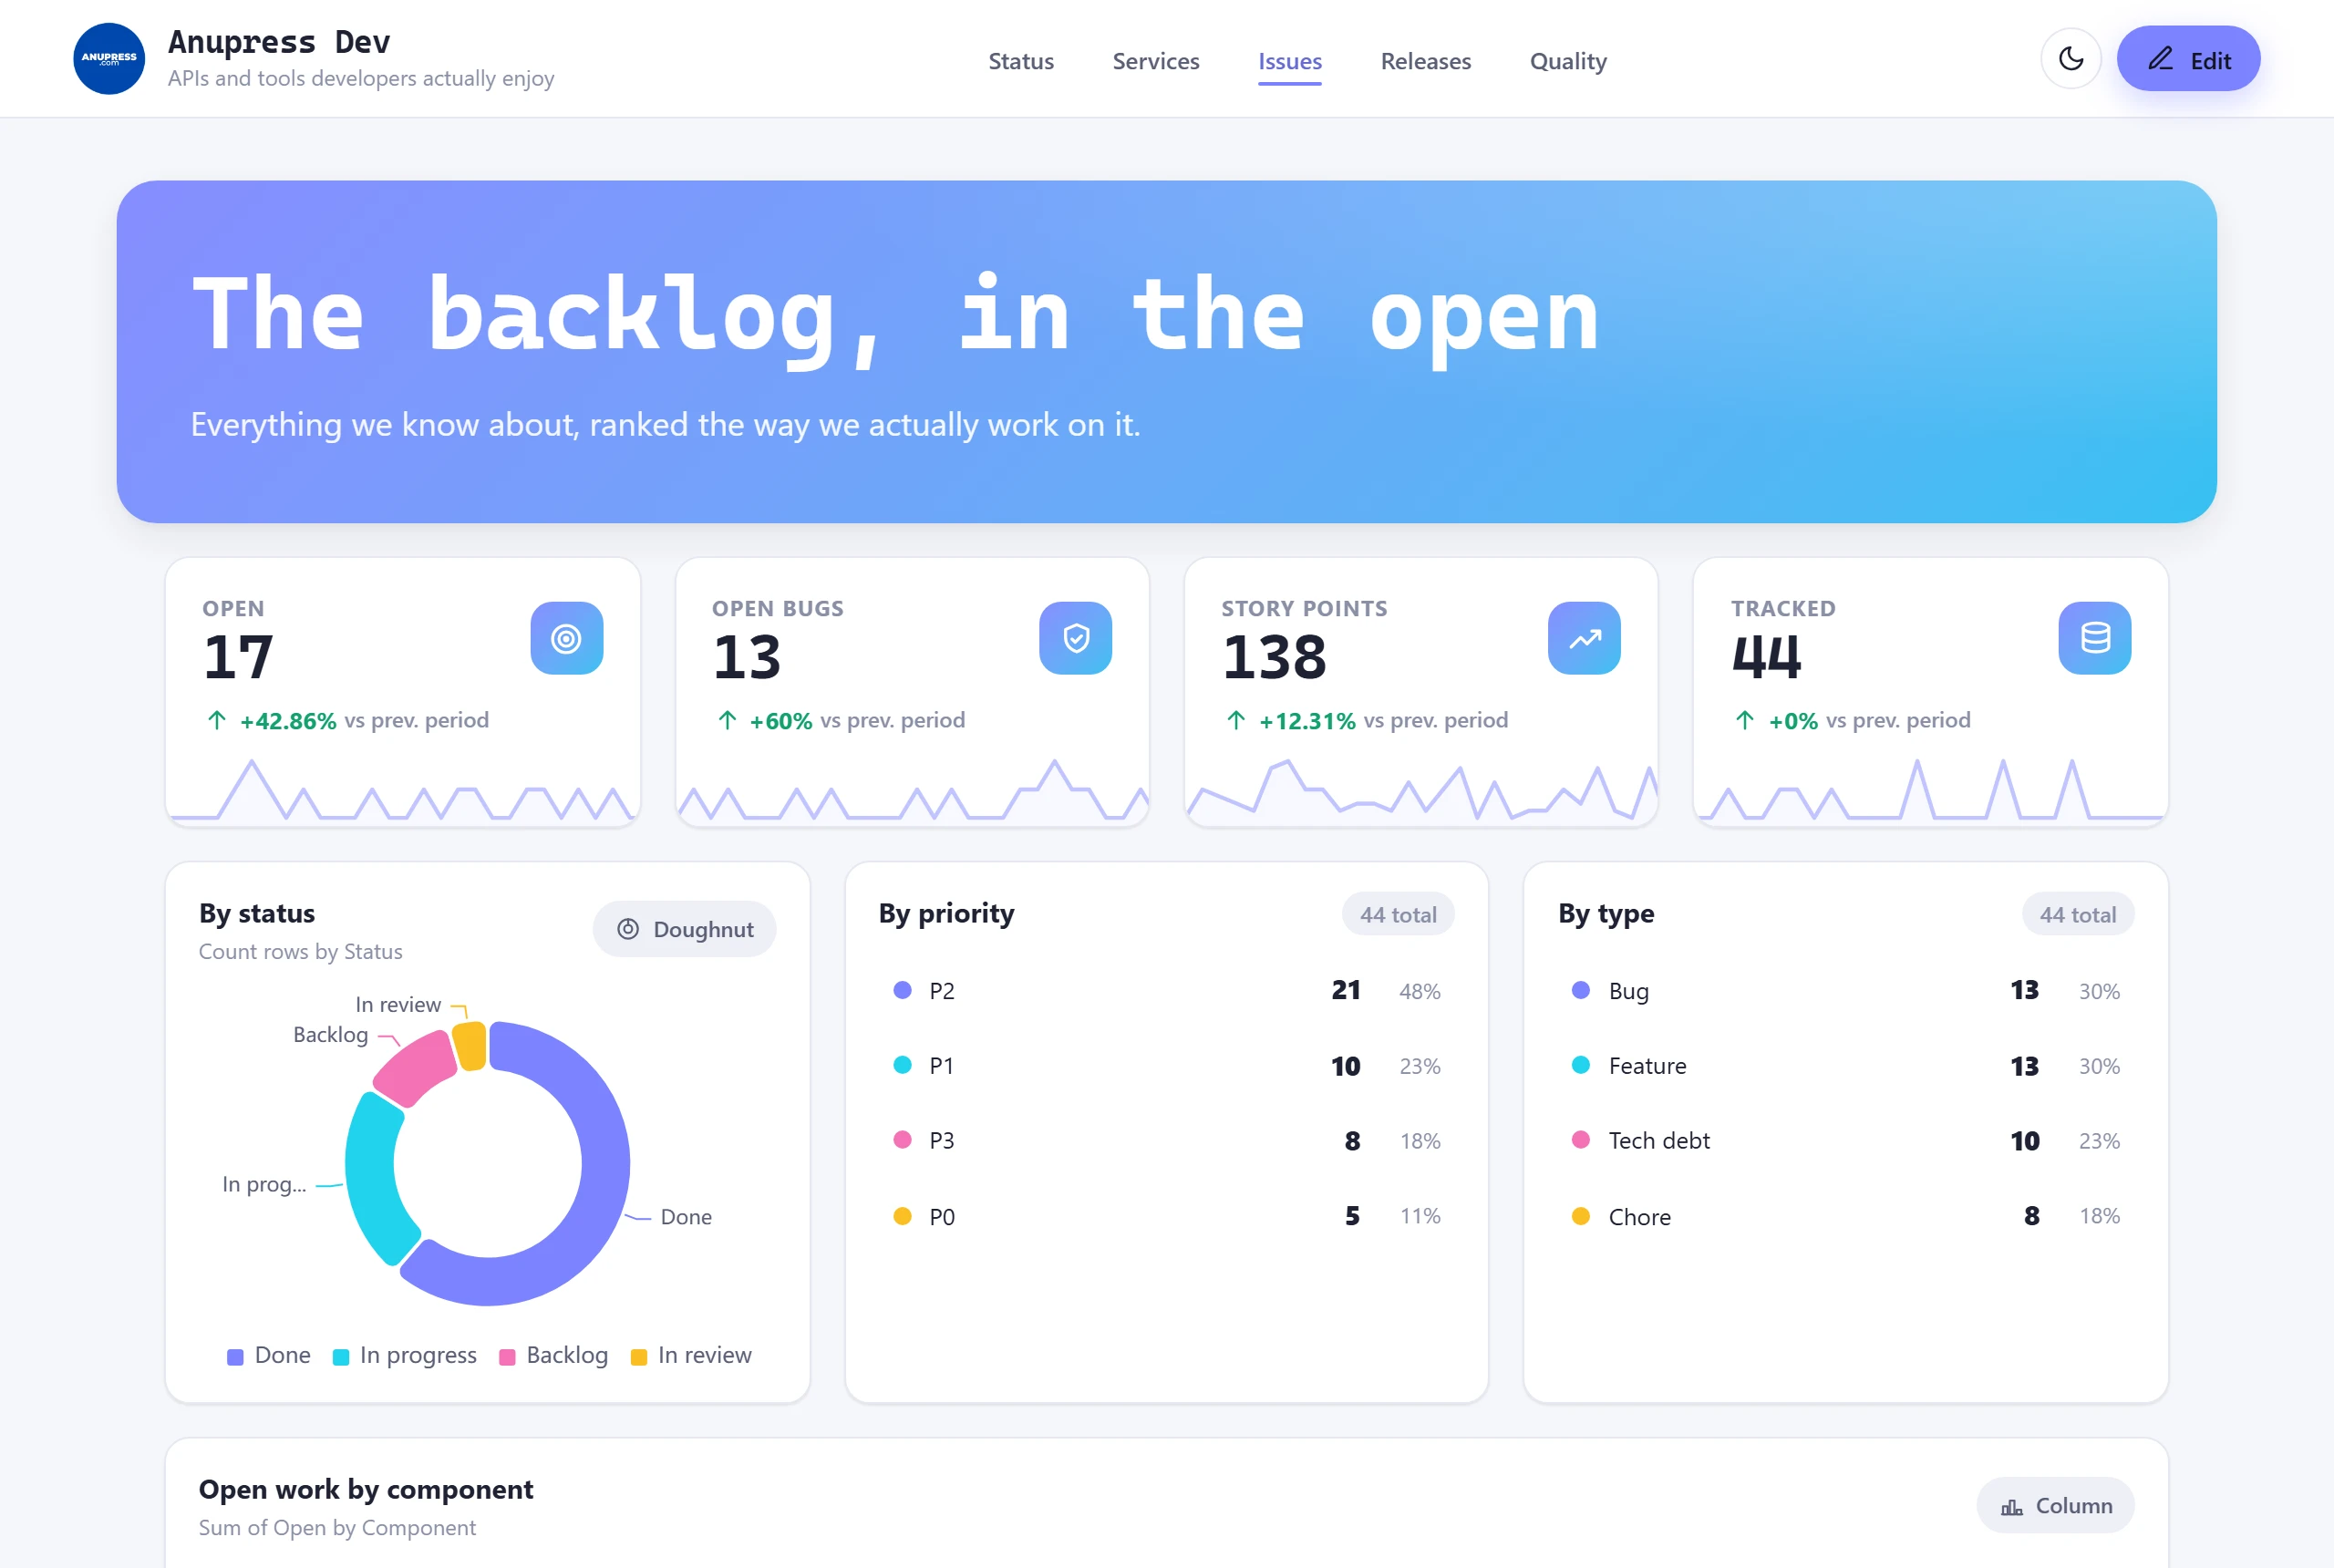
A status page plus an engineering dashboard, and the one template that installs in dark mode. Services report uptime, issues have severity and age, releases sit on a calendar you can drag to reschedule (the new date is written back to the table), and incidents carry time‑to‑recovery so the trend is visible, not anecdotal.
It reads like the public status pages engineering teams already know, except it’s your Grist tables underneath — close an issue in Grist and the dashboard follows. Gauges are used sparingly and honestly: uptime numbers sit near 100%, so the template compares them on an axis that starts where the differences live instead of pretending 99.2 and 99.9 look the same.
Sample tables: Services, Issues, Releases, Incidents, TestRuns
8. Small Business
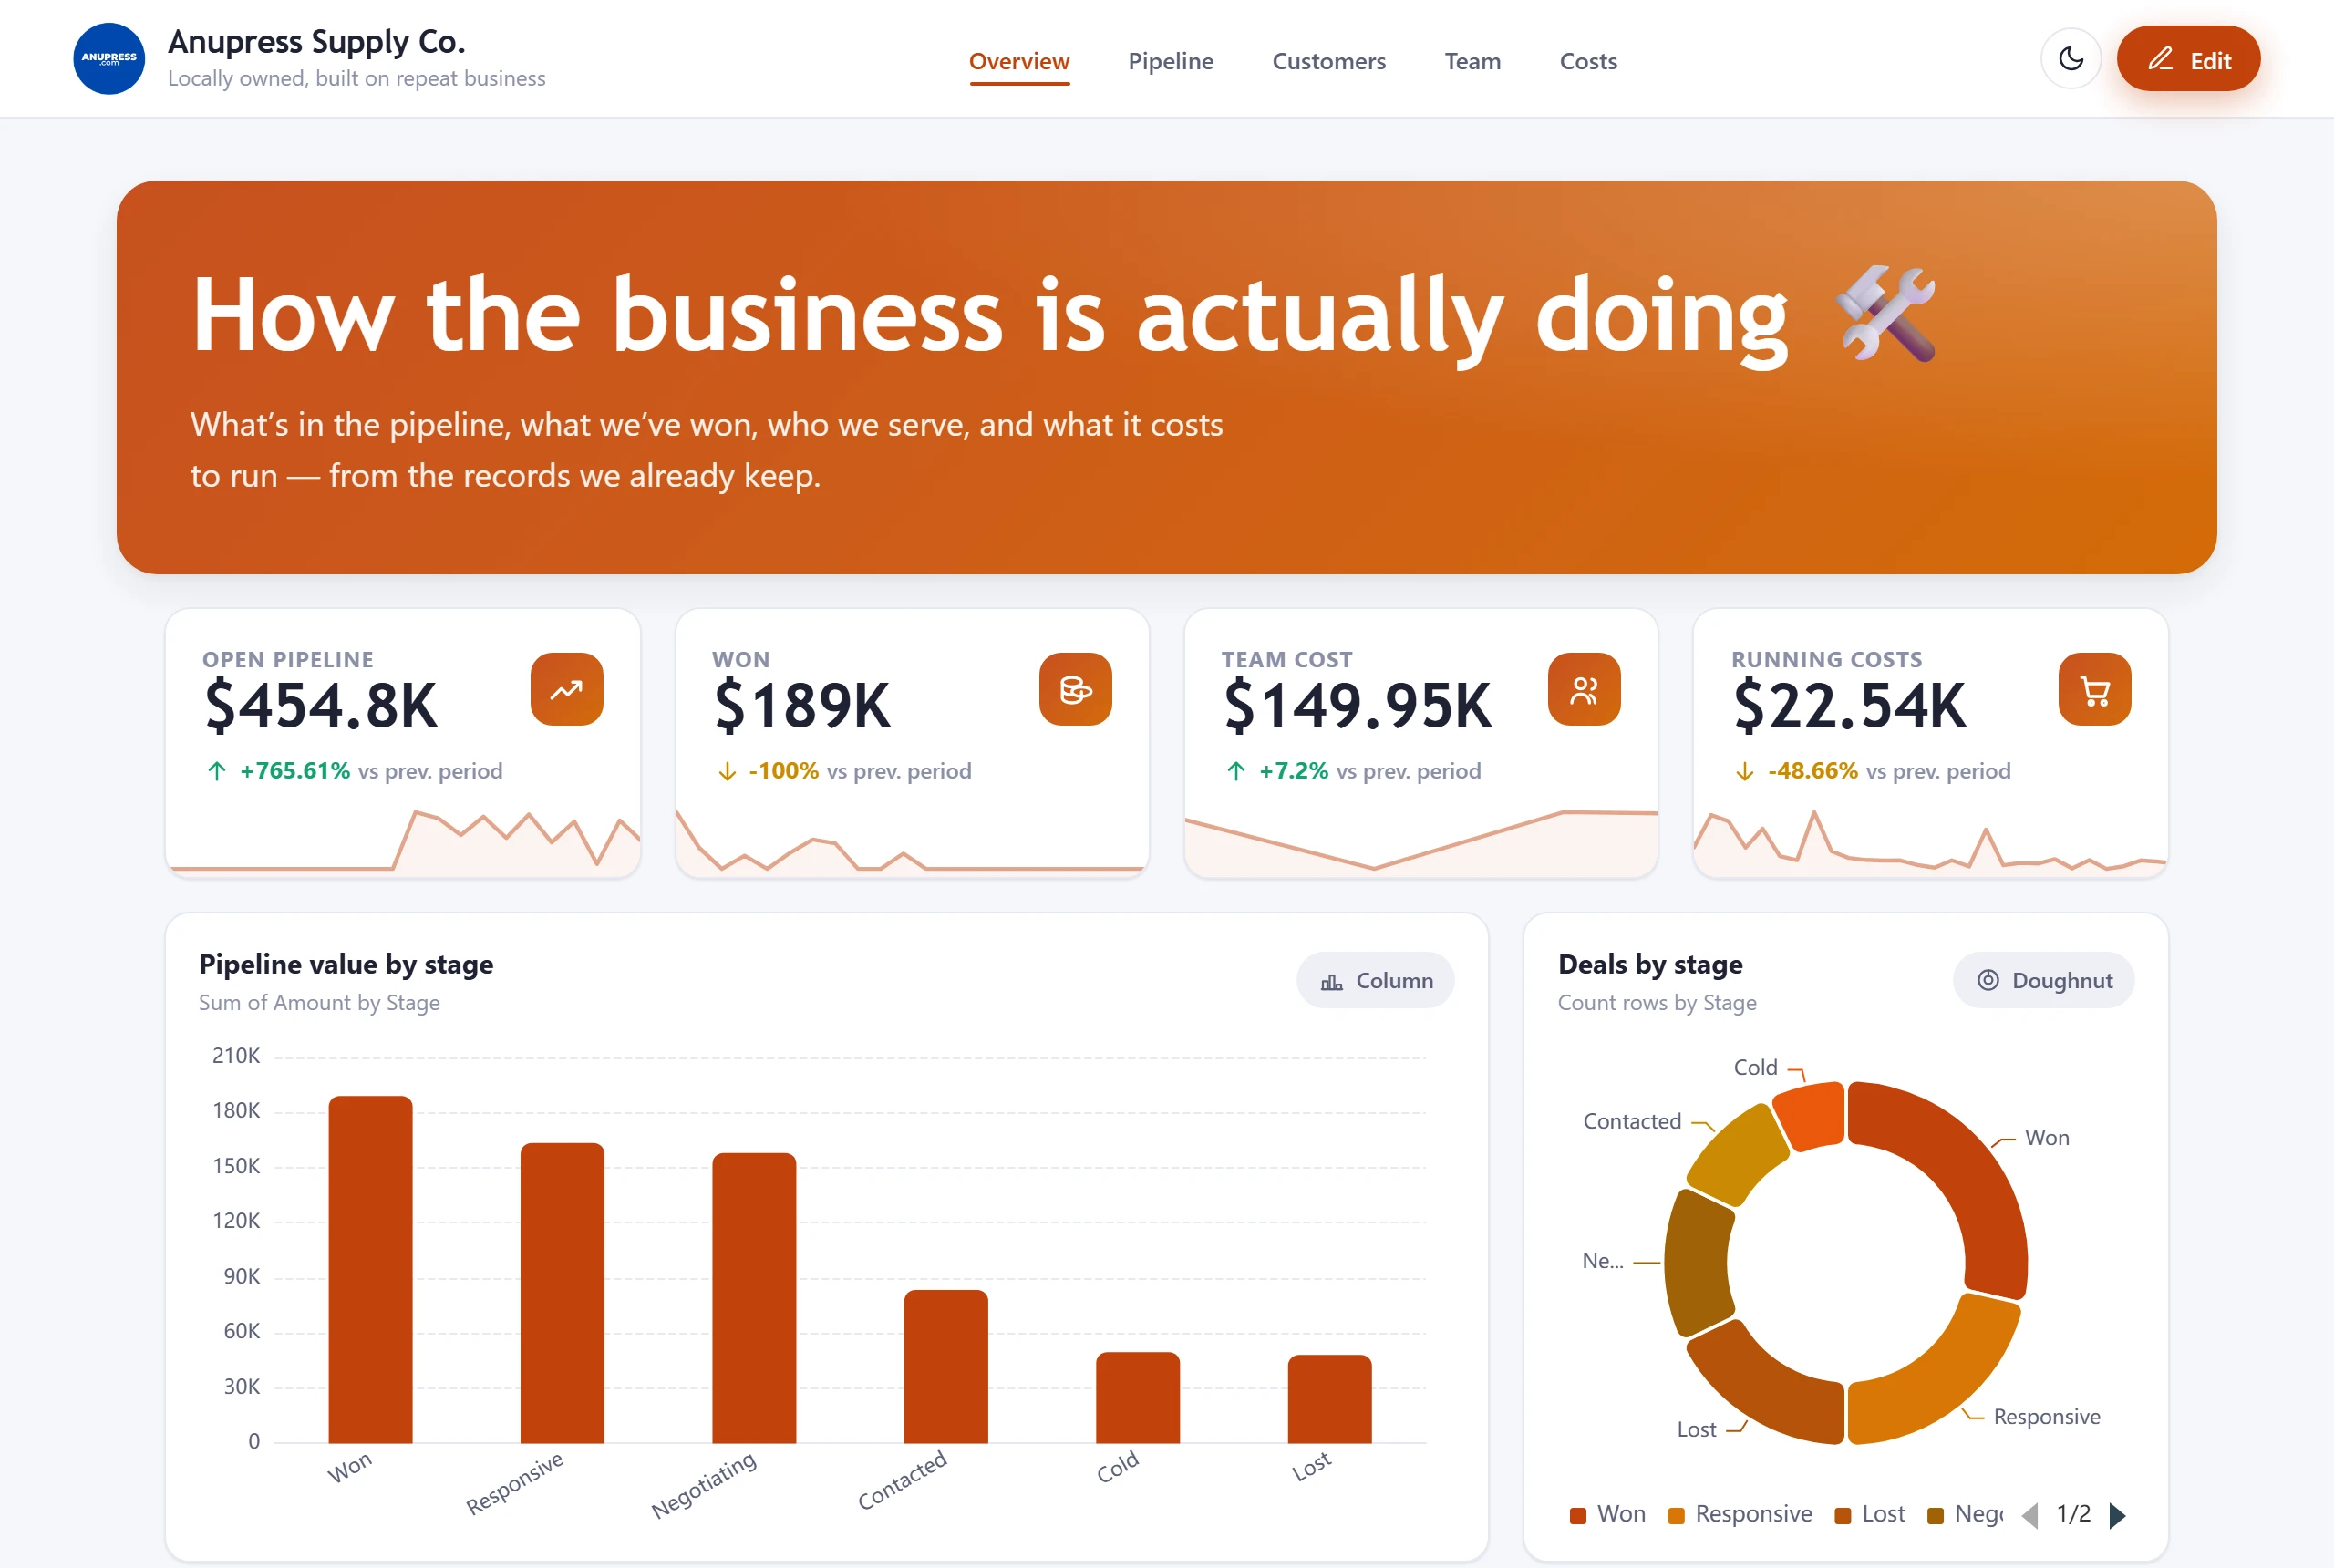
This is the “whole company on one screen” template for a business small enough that one person carries it in their head — it just puts what’s in their head on a page. Deals move through a pipeline funnel, customers belong to companies (ownership cascades from the account, the way small‑business sales actually work), the team page tracks who does what, and costs get their own page instead of hiding inside a P&L nobody opens.
It overlaps the Finance template on purpose; they answer different questions. Finance & Accounting asks “where is the money?” — this one asks “how is the business?”. Install the one whose question you ask more often.
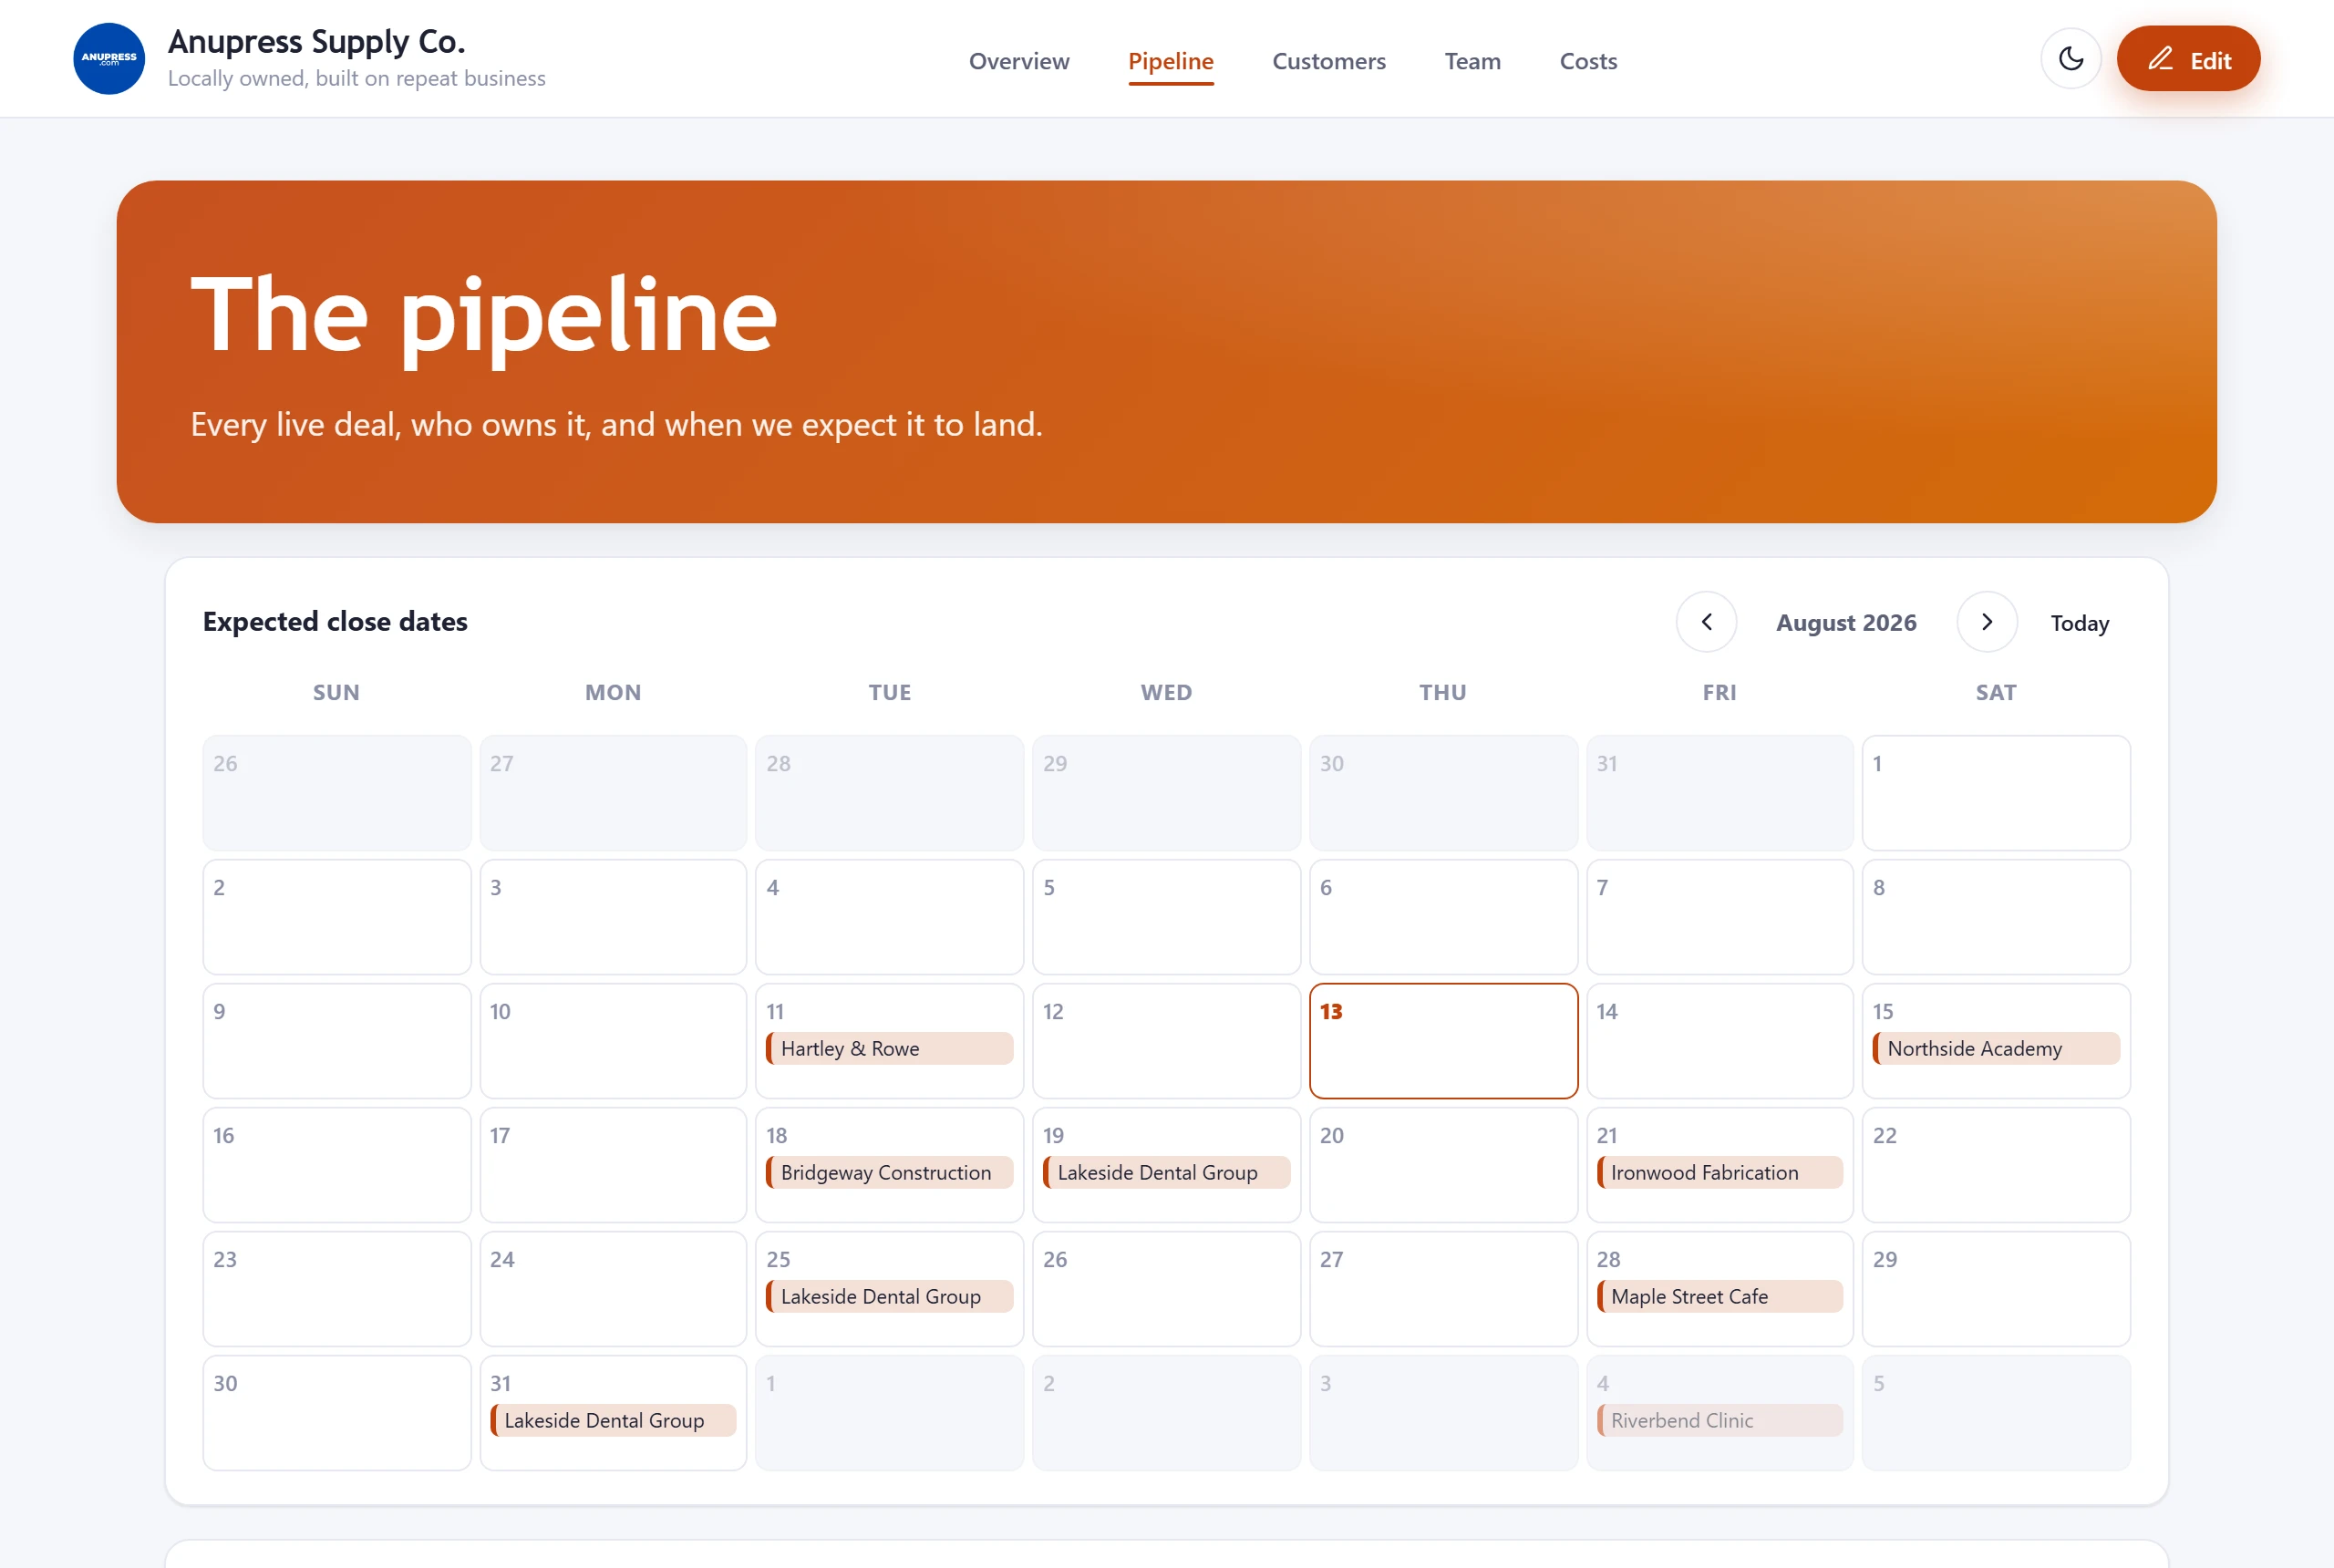
Sample tables: Deals, Companies, Contacts, Team, Expenses
9. Sports Facility
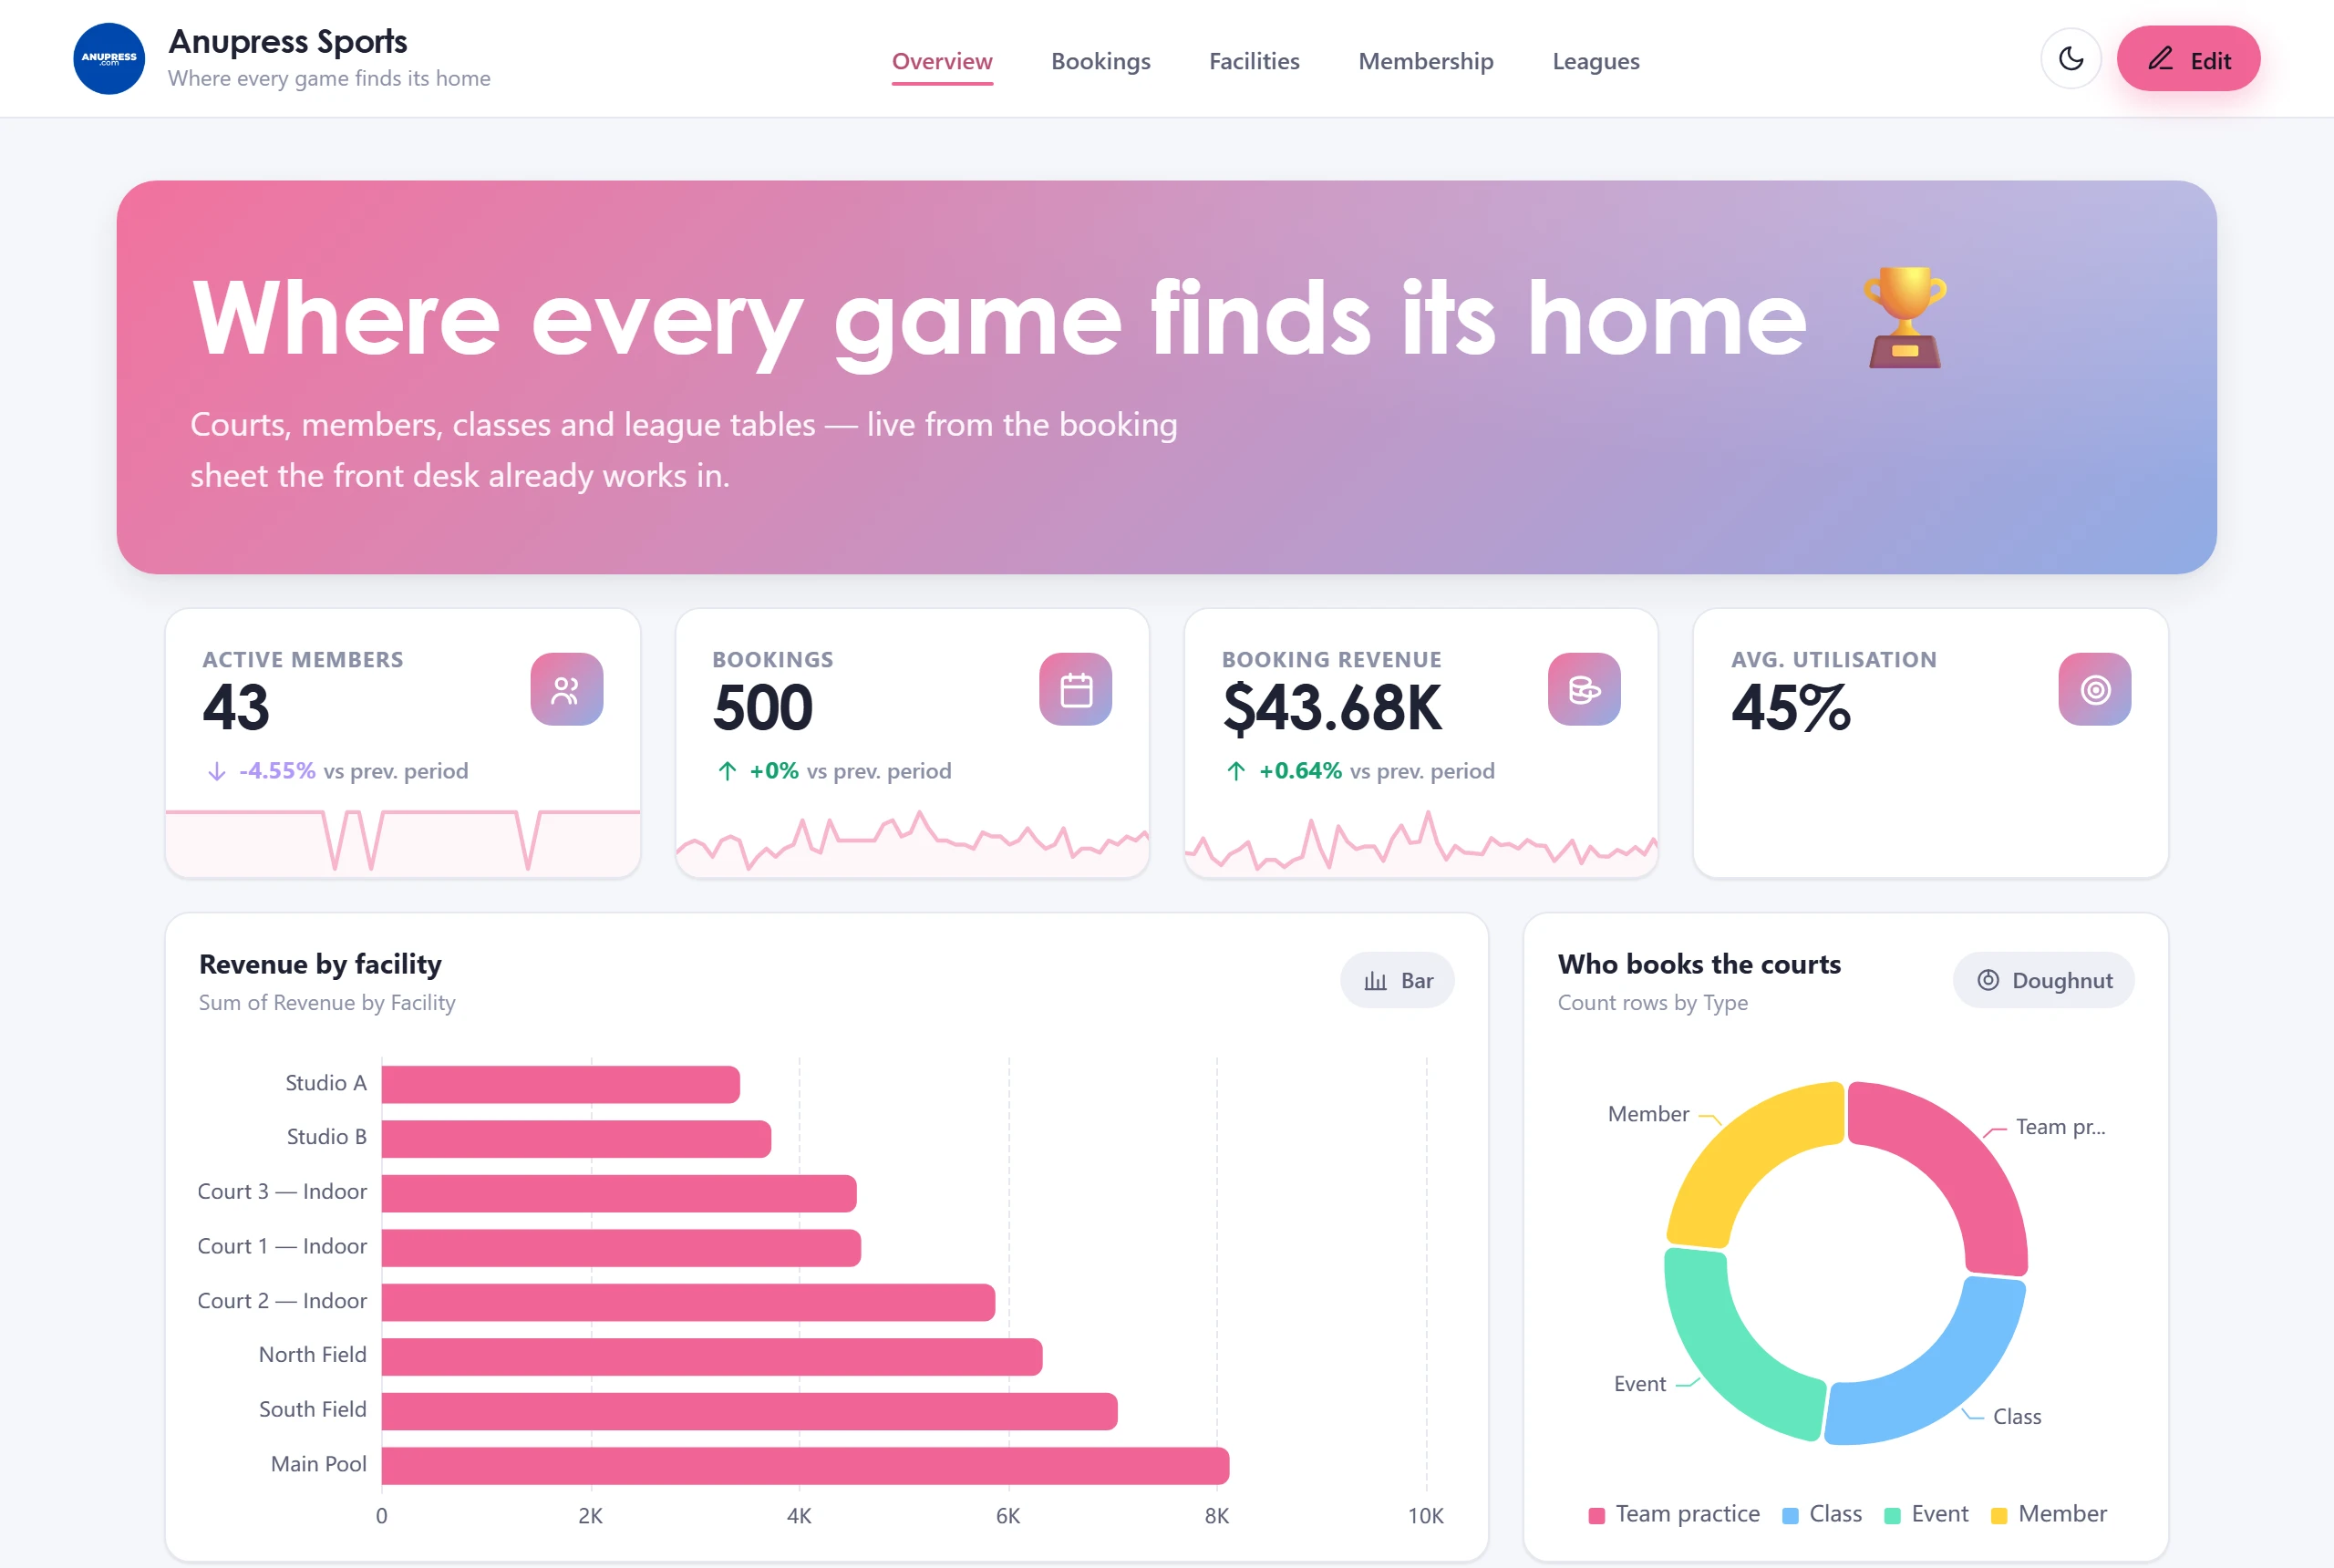
Made for the front desk of a gym, court complex or club: today’s bookings on a live calendar (drag one to move it, the table updates), court and room utilisation, membership counts by tier, class schedules and league standings. Utilisation is measured against bookable hours, not the whole day — a court that’s full every open hour shouldn’t read as 60% because the building closes at night.
The standings table uses the data table block’s highlight ranges to tint the promotion and relegation zones, which is the kind of small thing a league page needs and generic dashboards never have.
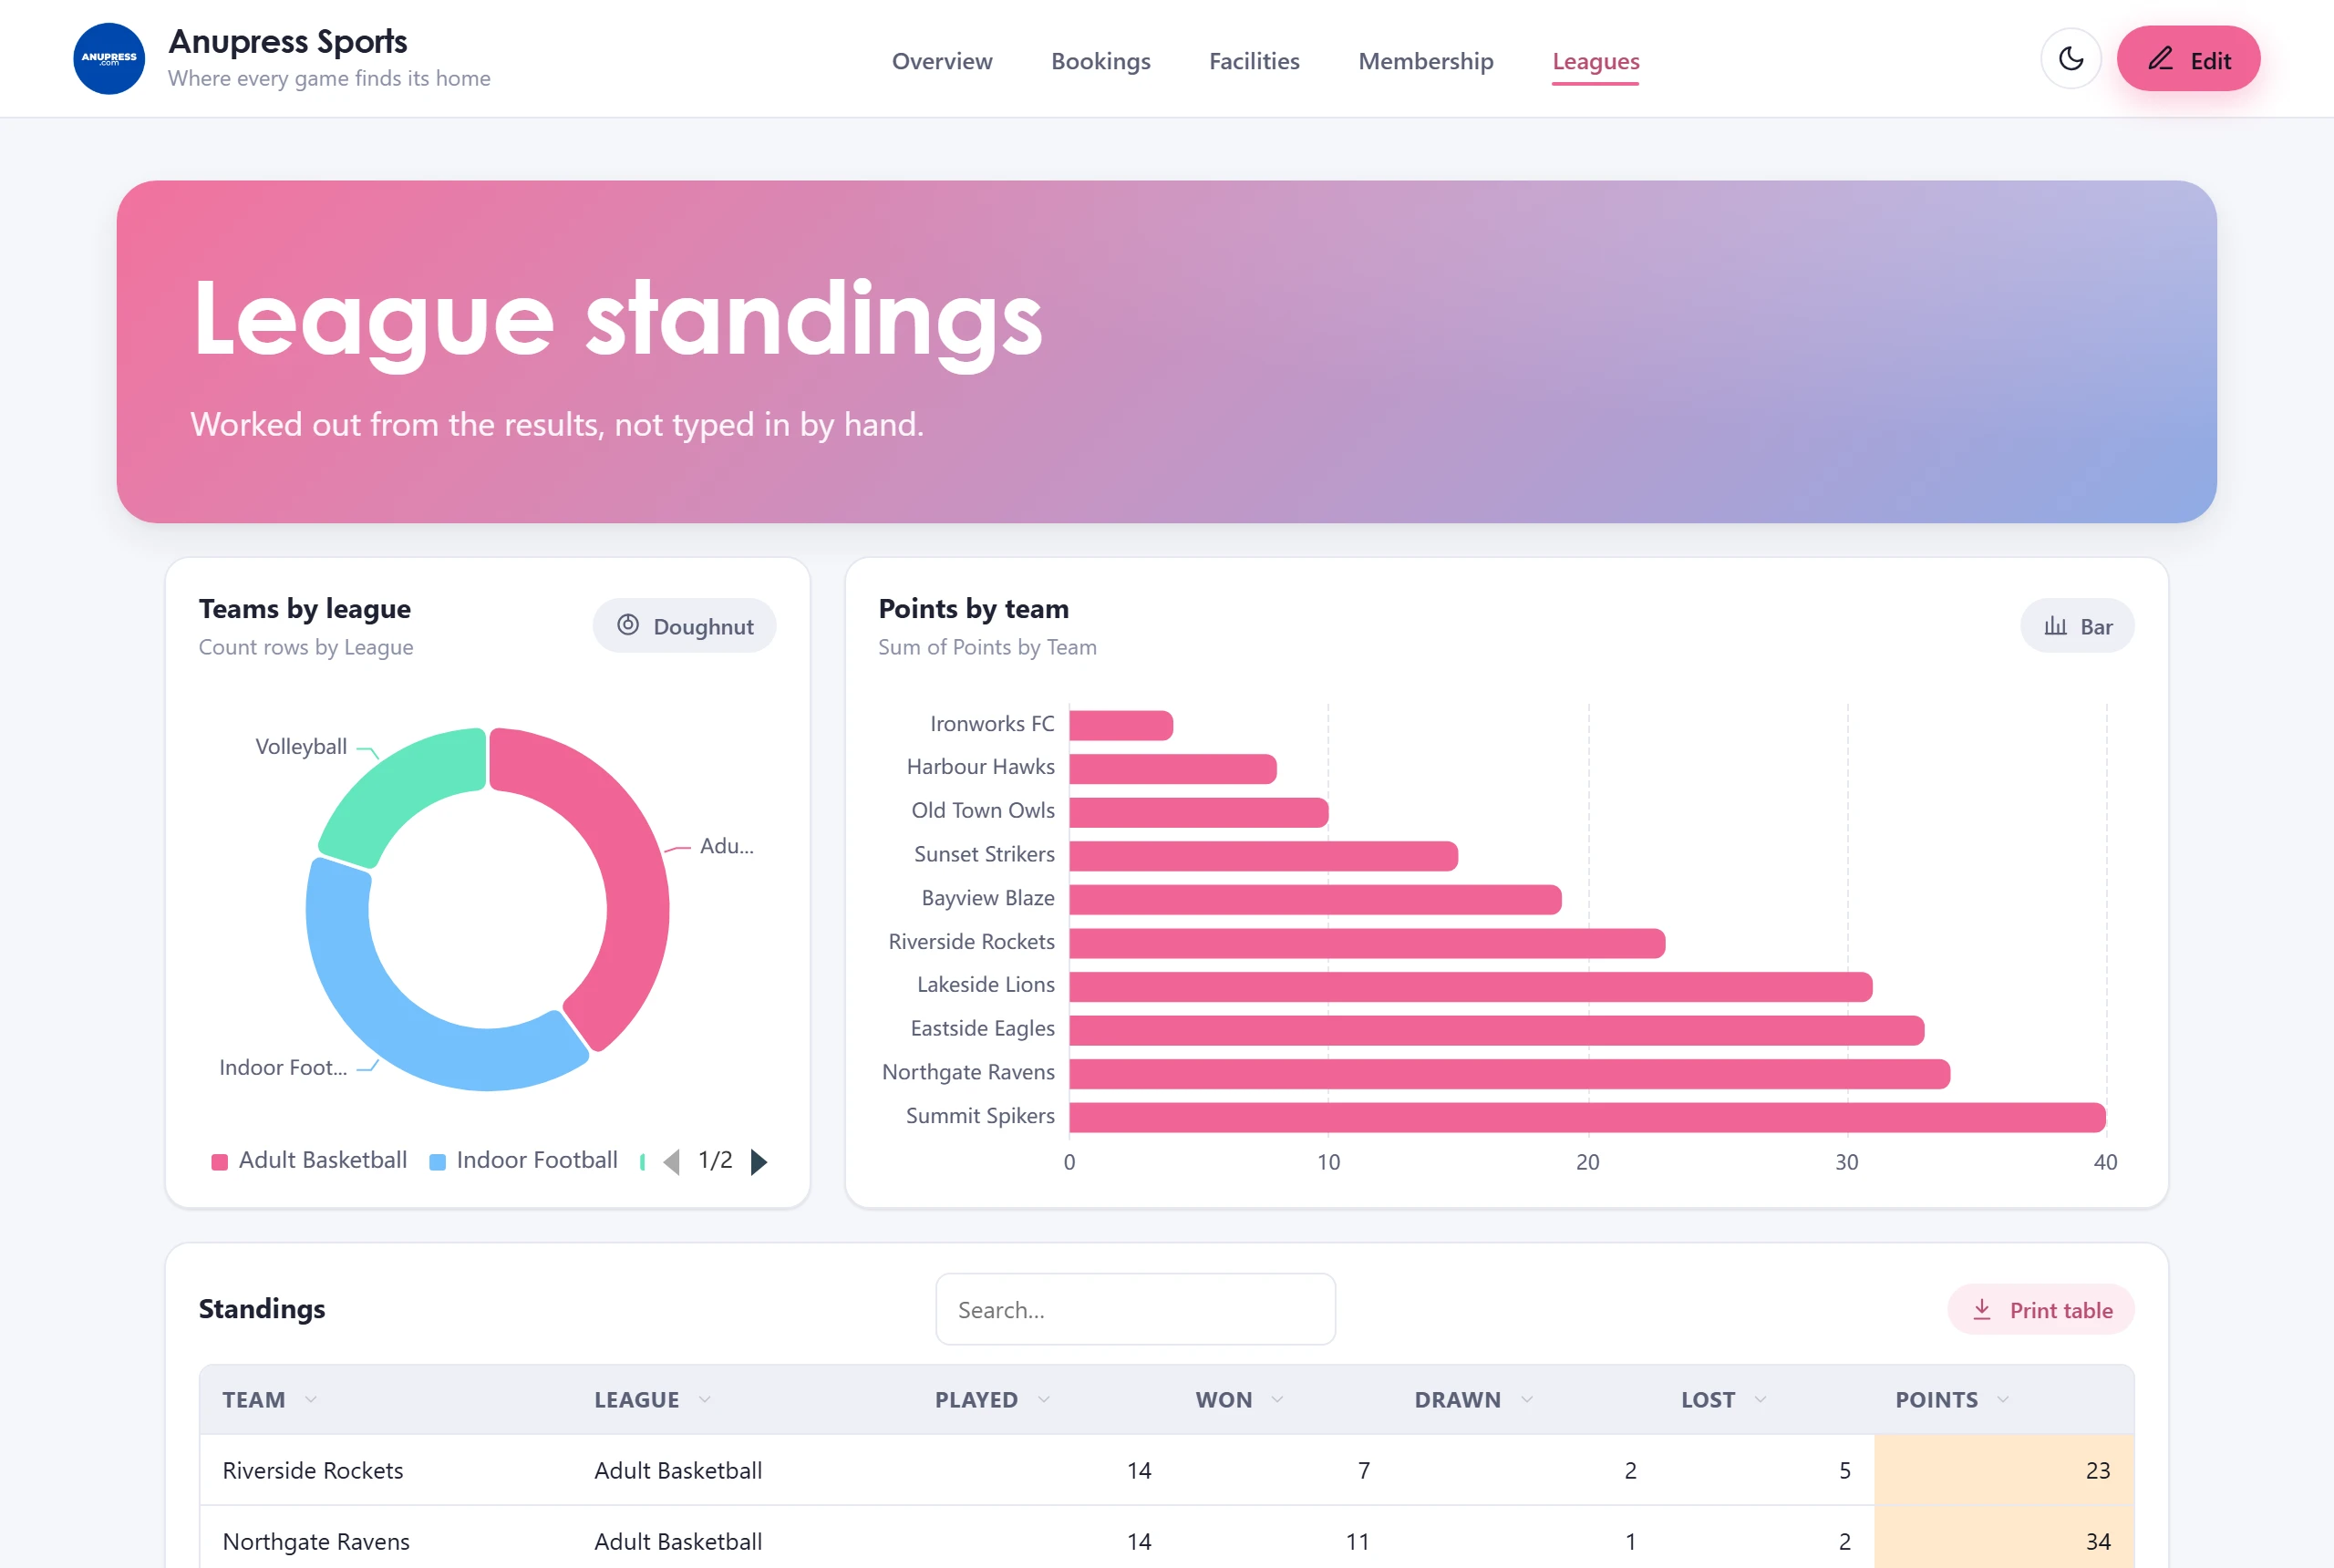
Sample tables: Bookings, Facilities, Members, Classes, Standings
10. Demo dashboard
The last of the ten Grist dashboard templates is the widget itself, explaining itself. The six‑page tour you see when you first load Advanced Charts is a template like the others, so you can always get it back: every chart type with a note on when to use it, live tables, a working invoice and calendar, and a page of the content blocks. If you use it as a learning sandbox and then wreck it, reinstalling takes one click — the picker will offer to reset it and says exactly what that discards.
You can try it right now without Grist: open the live demo.
Which Grist dashboard template should you install first?
The honest answer: the one whose sample tables look most like tables you already keep, because that’s the one you’ll wire to real data instead of admiring. A lab that logs samples in a spreadsheet is already halfway into Research Labs; a freelancer with an invoices table is halfway into Finance & Accounting.
If two of them fit, install the one whose question you ask more often — that’s the real difference between overlapping templates like Finance (“where is the money?”) and Small Business (“how is the business?”). And if nothing fits, apply the closest one anyway, look at how its pages are put together, then strip it back. Reverse‑engineering a working dashboard teaches the widget faster than assembling one from an empty page, and Start from scratch cleans up the sample tables whenever you’re done experimenting.
Grist dashboard templates: FAQ
Are the templates free?
Yes. All ten Grist dashboard templates ship inside the free Advanced Charts widget. There is no marketplace, no unlock and no paid tier.
Can I use a template with my own tables instead of sample data?
Yes. During install, each table the template uses can be pointed at one of your own, with a column‑matching step so the blocks know which of your columns is which. Your table is only read, never modified.
What happens to the sample tables when I switch templates?
The widget keeps a record of every table it created. When you switch templates or start from scratch, those tables are listed with checkboxes for cleanup. Tables you created yourself are never on the list.
Can I change a template after installing it?
Everything is editable: pages, blocks, text, colours, fonts. A template is a starting point, not a locked design. The picker marks the installed one as Active, or Active · edited once you’ve changed it — and warns you before a reinstall throws your edits away.
Which template should I start with?
Whichever of the Grist dashboard templates has sample data that looks most like your tables. If none fits, install the closest and repoint its blocks — or start from scratch and use the chart wizard block by block.
Keep going
These Grist dashboard templates grow the way the widget does: from requests. If your industry is missing, say so and it goes on the list.